
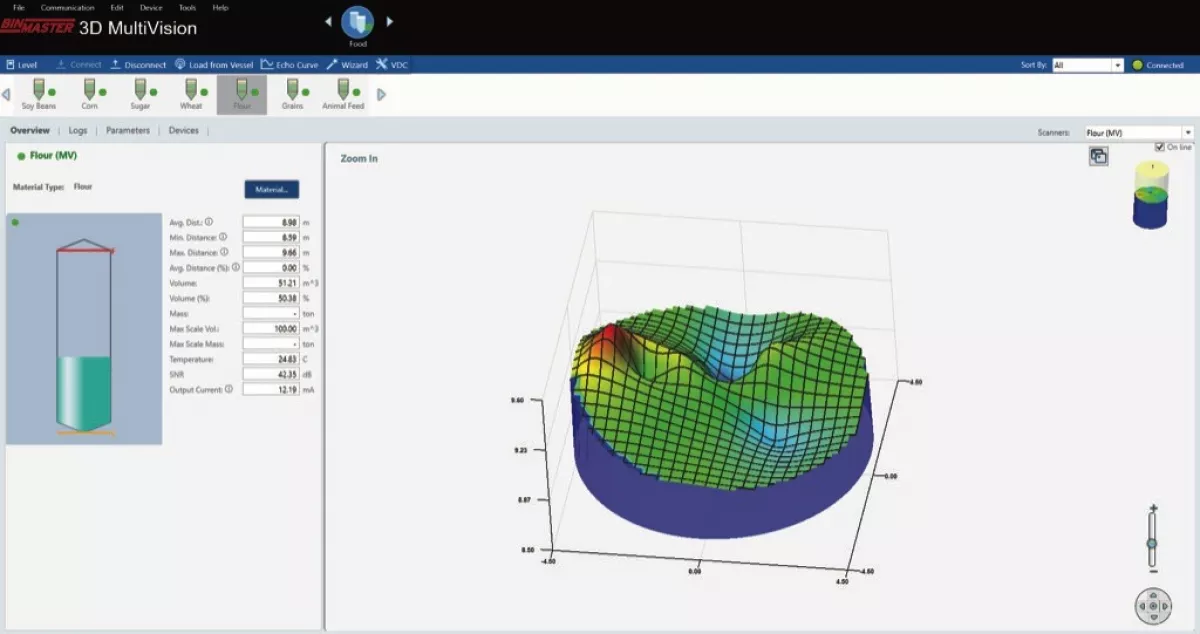
Each sensor comes with 3DVision software that reports the lowest and highest points detected and the average level based upon a weighted average of all measurements in the bin. For the MV and the MVL models, a colorful graphical representation indicates where high and low spots exist in the silo. 3D scanners keep pushing the boundaries – and addressing the concerns of increasingly complex food operations. This article shares a few of the newest innovations.
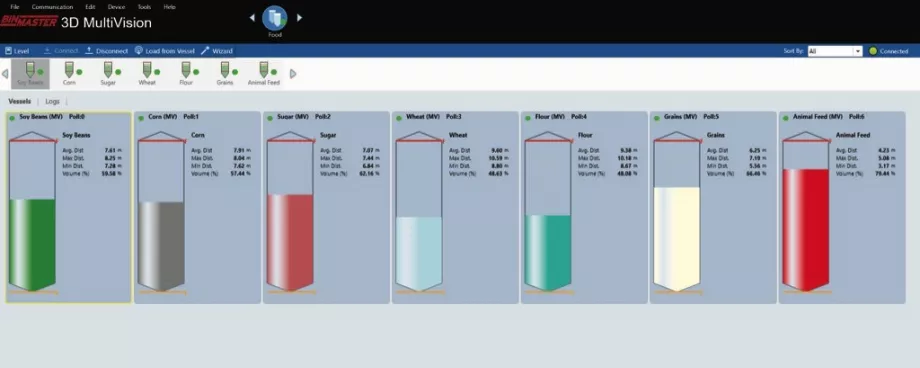
View multiple Silos on a single Screen
MultiVision software for inventory visibility across an organization
Inventory management affects multiple departments across a food processing organization. Plant personnel need adequate inventory for production, purchasing needs to know what to order and when, and finance needs accurate valuation for financial statements. To provide corporate-wide visibility, the optional 3D MultiVision software enables users to view data for multiple bins in a single window. And since it is Windows-based, it can be configured for 24/7 access via an organization’s Local Area Network (LAN).
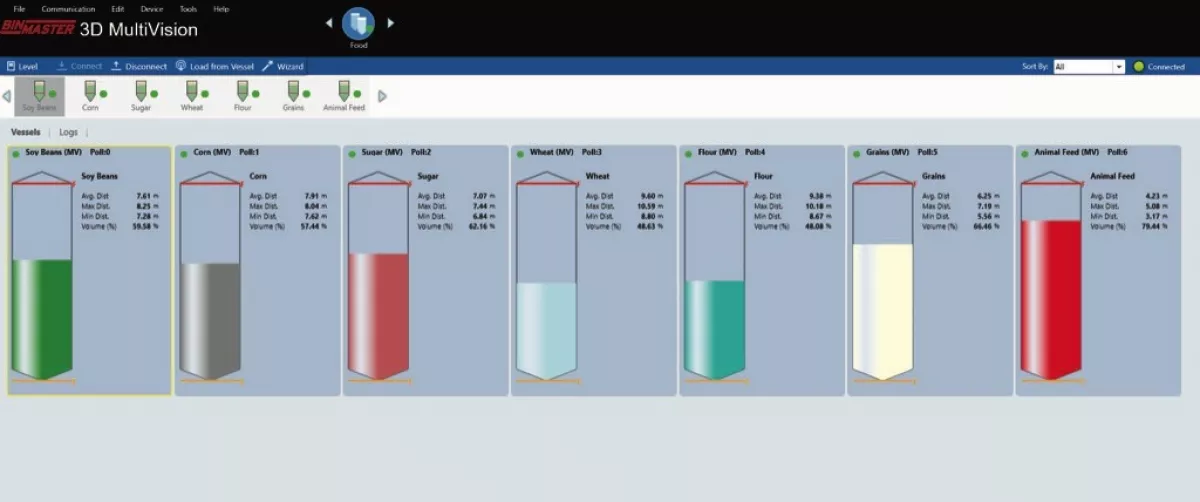
MultiVision software can be used with all versions of the non-contact, dust penetrating 3DLevelScanner including the RL, S, M, MV and MVL models. By clicking on a single bin, users can zoom in on detailed information for the bin including minimum, maximum, and average levels. For the MV and MVL models, they can also see the 3D visualization of bin contents. The software allows multiple users at multiple locations to view bin level and volume data on a permissions basis.
3D MultiVision software makes it easy to share real-time bin data across the entire organization (or with vendors using VMI) to improve purchasing, logistics, operational decisions, and financial management. With user-friendly setup and intuitive operation, each user can customize their screen to view all bins or a group of bins and color-code bins by material type. Users can set high and low-level alerts to be notified when bins reach critical levels. Because the software is installed on the LAN, there are no third-party applications or data access fees.
Teflon-Coated Sensor for Clingy Materials
Reduces maintenance in powders and sticky granules
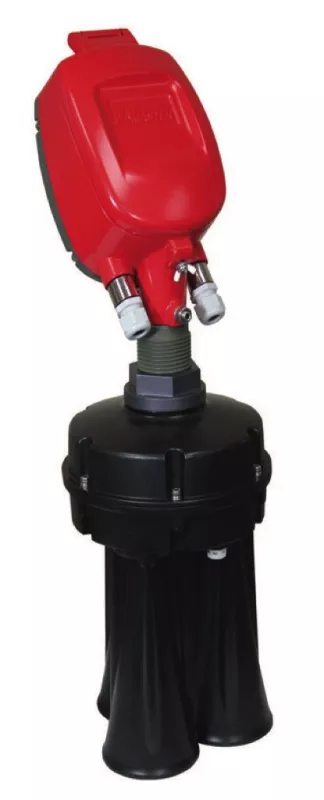
For materials that want to cling to the sensor, a Teflon-coated transducer can be a great option. The Teflon coating resists buildup of dust, ensuring the scanner performs optimally in challenging materials such as powders or solids that generate excessive dust when the bin is filling or active. This special finish also extends the maintenance cycle by significantly reducing the need to clean the device after prolonged periods of use.
Some common applications for the Teflon-coated transducer include meals, sugar, starches, brans, and other similar materials that are prone to cling to surfaces. It is especially appropriate for food processors in industries such as baking, pasta, and candy where non-contact technology is a requirement for food safety. Grain millers will also find measuring ground soybeans, wheat, rice, or corn less troublesome when using the Teflon-coated model of the 3DLevelScanner.
Detect and Alert to Center of Gravity Danger
Prevent silo collapse or damage using 3DLevelScanners
Many powdered and solid substances used in food processing tend to clump, pile unevenly, and flow unpredictably from storage vessels. Not only does this make monitoring the volume of material inside the vessel challenging; uneven disbursement of material can also take its toll on the storage vessel itself.
Over time, the walls of steel or concrete silos have been known to wear or fail causing cracking, denting, buckling, and bending. In the most severe cases, it can lead to catastrophic silo collapse. This has been seen in grain bins worldwide, where the walls of large storage vessels give way to the weight of grain that has built up on one side of the bin over time.
For plant operations that want to detect uneven loading of silos that contributes to structural wear or failures, there is now a software option that uses 3DLevelScanners to identify the location of the center of gravity, display it graphically, and alert when the center of gravity falls outside of a predefined area.
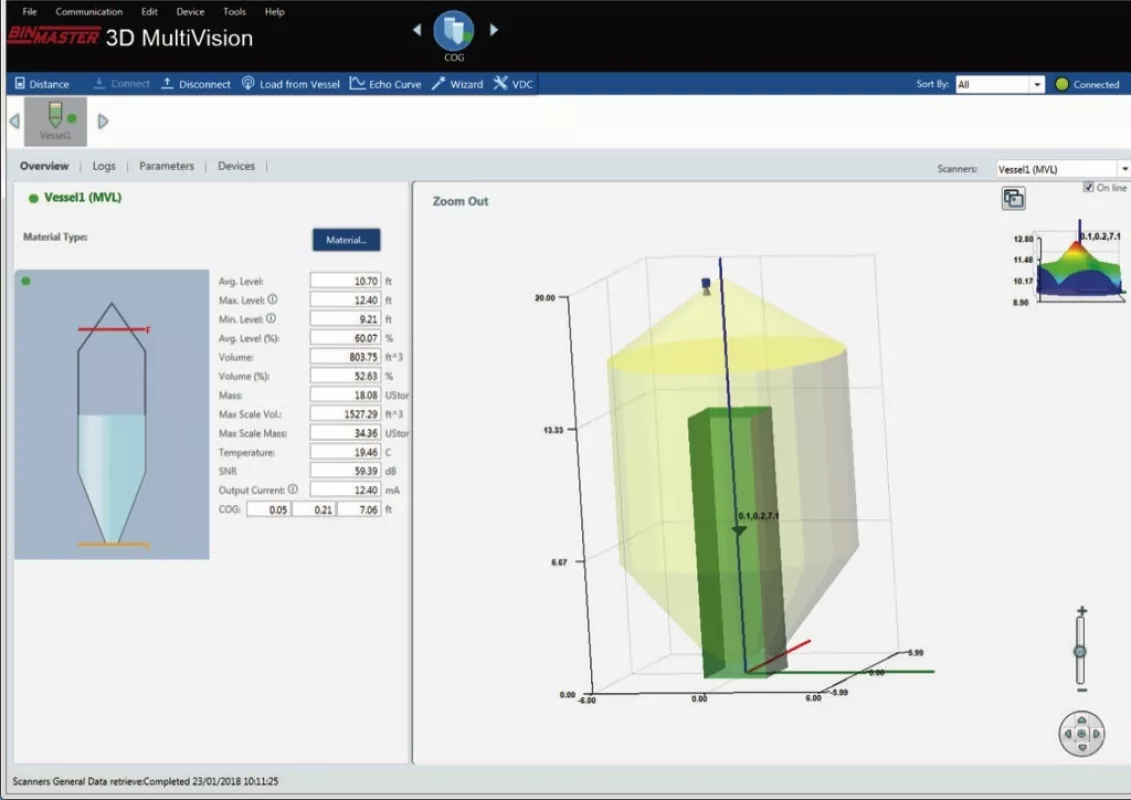
A 3DLevelScanner is mounted on the roof of the silo in an optimal location to view the material surface in the silo. Level measurements are used to determine the X, Y, and Z coordinates of the center of gravity based upon the material topography. The coordinates are processed in 3DMultiVision software via a proprietary RS-485 communication protocol. Users define the alert parameters and accepted area into which the center of gravity must fall. A 3D visual will indicate where the center of gravity is located and show if the current center of gravity falls in the acceptable area.
In this first example (see image below), it is evident from the 3D graphic that material is disbursed evenly and the cone is up. The average, minimum, and maximum levels are displayed along with the volume and mass. Also, volume as a percentage full and the maximum volume are displayed in the software. The acceptable zone for the center of gravity is indicated in green and the Center of Gravity of 0.05 along the bottom of the readings falls clearly in the acceptable zone.
Operations can use this unique solution to help reduce structural stress when loading or emptying a silo. It is a valuable preventive maintenance tool that can alert to the need for inspection or cleaning. Use over time can prolong silo integrity and create a safer environment by alerting to potential structural stress caused by uneven loading.

