(From the archive of ”bulk solids handling", article published in Vol. 36 (2016) No. 1 , ©2016 bulk-online.com)
1. Introduction
The “cost of dust” to industry, the community and government can be quite significant, especially when considering the “big picture” of industrial dust emissions. For example: loss of material and export income; increasing workplace dust emissions; deteriorating ambient air quality and human health; residential complaints; increasing direct costs to industry (e.g. dust monitoring/testing, dust control equipment, housekeeping, maintenance, premature failure of components, shutdown of process/plant, loss of production, fines and prevention notices, project application rejections). These problems are exacerbated as larger quantities of bulk material are mined, processed and/or handled, and especially as the products become finer.Some of the “traditional” ways to control fugitive dust emissions are summarised below:
-
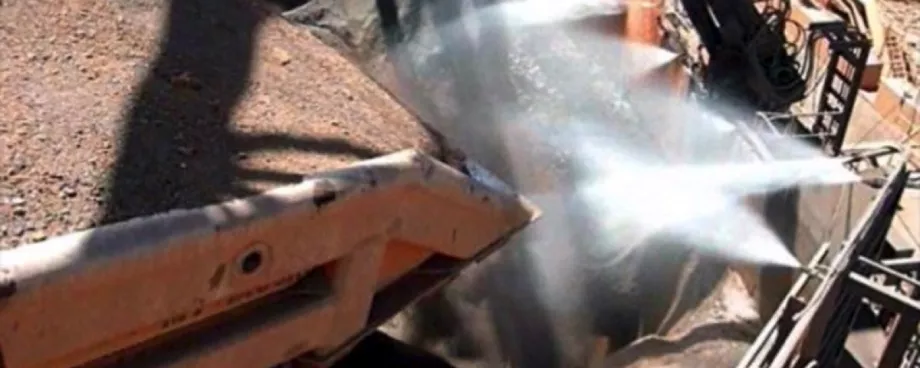
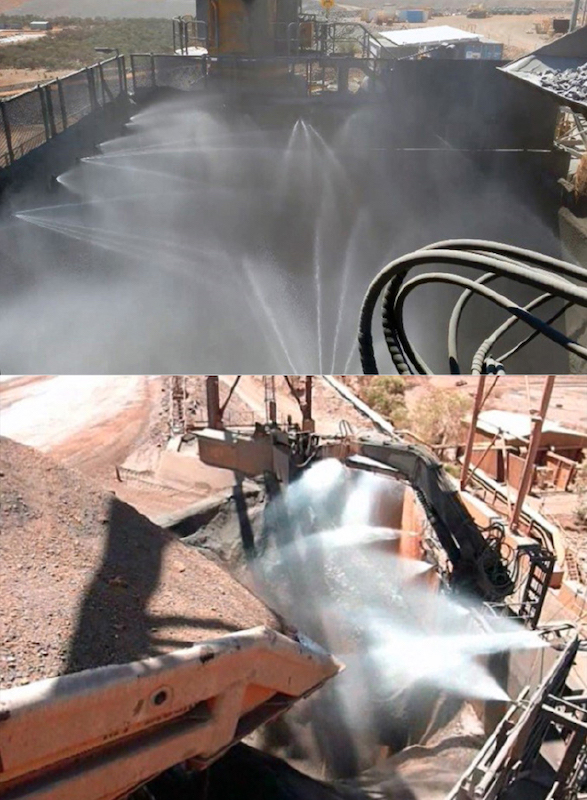 Fig. 1: Examples of ROM pit water spraying systems to suppress airborne dust (video snapshots). (Pictures: © Wypych, Ronda)
General ventilation (i.e. dilution of airborne dust concentration to acceptable levels).
- Containment (e.g. enclosures with integral filtration).
- “Push-pull” systems, using the “air-knife” or “air-curtain” concept.
- Dust suppression veneer (surface) treatment (e.g. rail wagons, trucks, stockpiles) or total particle treatment.
- Water spraying systems trying to suppress airborne dust particles (e.g. see Fig. 1).
- Dust agglomeration (via ionisation or ultrasonics).
- Local exhaust ventilation (LEV), also known as dust extraction, which is the one of the most common methods of dust control found in industry.
- Wind barriers or diffusers (e.g. trees, walls, mesh) to help contain dust within industry boundaries.
- Vegetation (e.g. grass, shrubs) to help capture/trap airborne dust over large flat areas.
Most of these dust control measures really only treat the “symptoms” of dust generation and are considered as “protection” methods (i.e. they do not deal with the root causes of the problem). Also, some have been found to be relatively inefficient in terms of controlling fugitive dust emissions. For example:
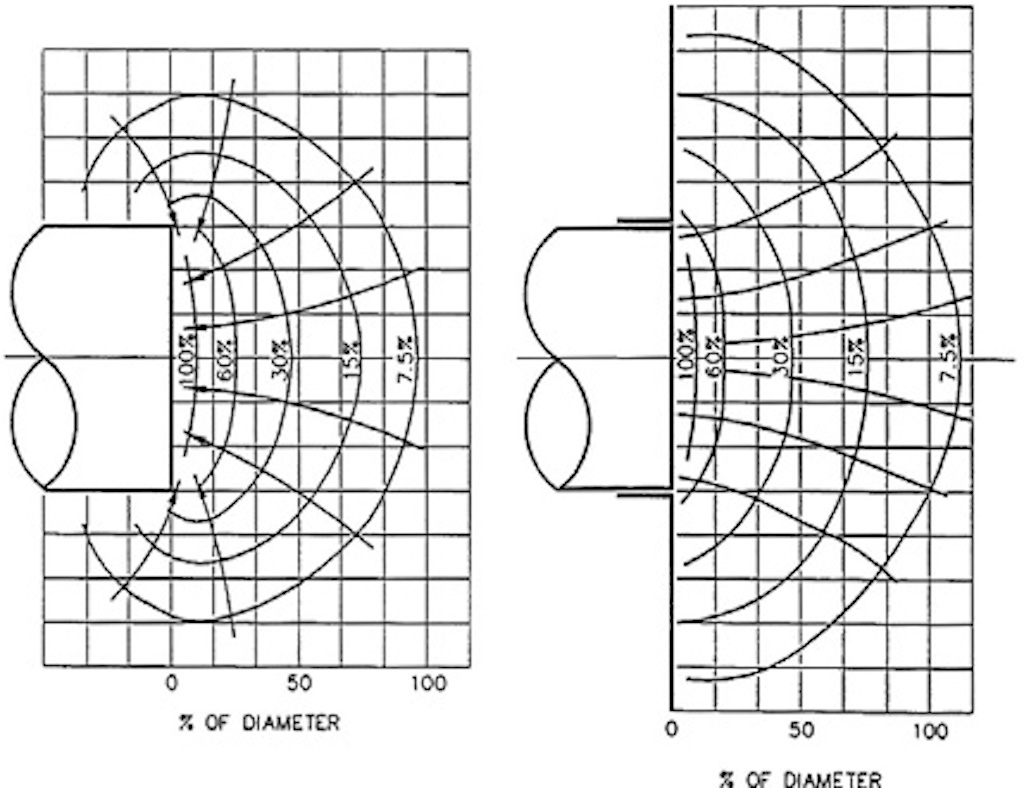
- LEV requires suction flows, which can be relatively inefficient in capturing airborne dust, where the exhaust velocity reduces dramatically from the face of the hood, as shown in Fig. 2;
- traditional water spraying systems, such as those shown in Fig. 1, are inefficient in suppressing fine dust (due to the coarse droplets produced) and cannot seem to cope with associated air flows and external disturbances, such as cross winds;
- dust suppression veneers need to be re-applied whenever the treated product surface is broken or disturbed (e.g. after loading/unloading trucks or rail wagons).
The following areas have been identified to be some of the main causes or “offenders” of fugitive dust emissions: ROM pits; dump hoppers at truck/rail unloading stations; stockpile stacker/reclaimers; conveyor transfers; crushing stations; and haul roads in open cut mines where trucks continuously generate/agitate fine dust, which is then easily dispersed by cross-winds.To achieve a step-change improvement in understanding and solving fugitive dust emission problems for industry, more fundamental research needs to be undertaken to address the application areas listed above. The following sections summarise some of the new technologies that are being researched and developed at the University of Wollongong for this purpose. Some industrial case studies completed in collaboration with Enviromist are also included to demonstrate some particular features and results.
2. Dustiness
Problem quantification is an important early step in the design or troubleshooting of a dust control system. Two standards that can be used to quantify the dustiness of bulk materials are: AS4156.6 (2000), which was originally developed for coal; and EN15051-2 (2013), which was developed for a wider range of bulk materials. Fig. 3 shows the two different rotating drum dustiness testers developed/used by BMEA based on these standards.
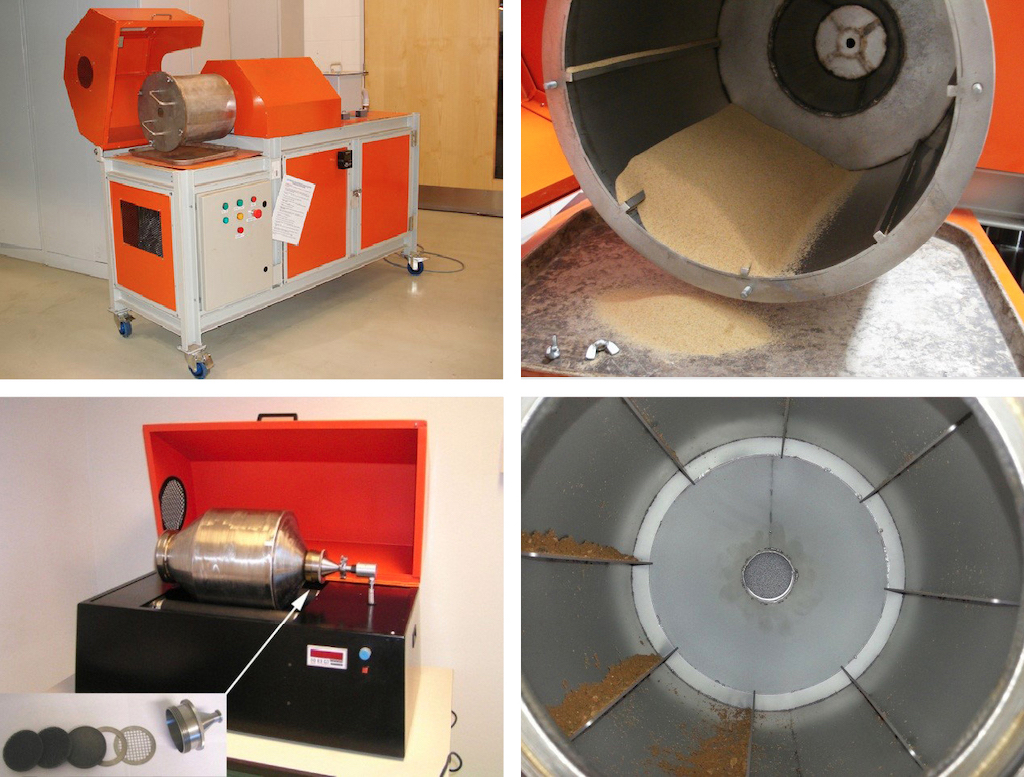
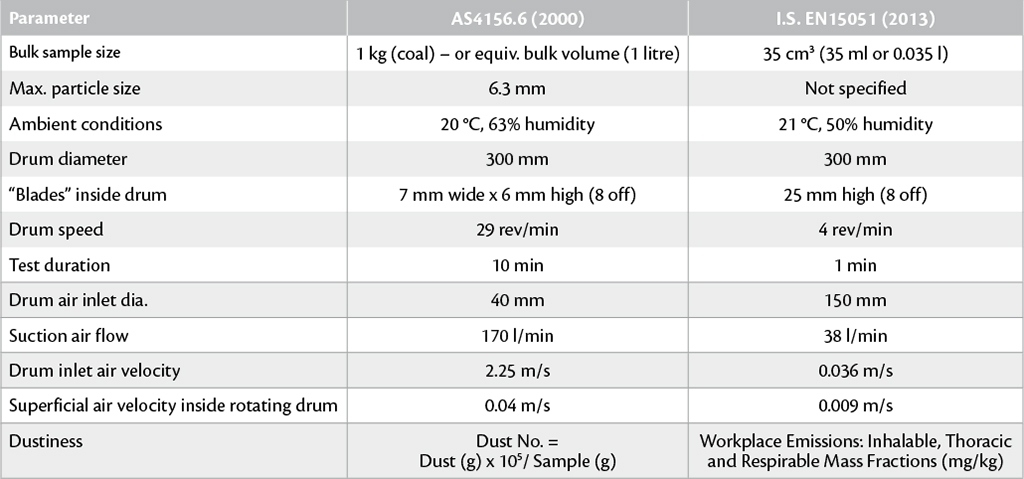
Examination of these two standards has identified some key differences that can influence the accuracy and validity of the results from the two rotating drum tests. The key differences are summarised in Table 1. The amount of material required in each tester is quite different (e.g. 1000 versus 35 ml), as can be seen in Fig. 3. This will affect the amount of dust collected. The differences in test duration, rotational speed and extraction air flow will also affect the amount of dust generated and hence, collected.
There are also some fundamental differences in the overall aim or focus of each standard. AS4156.6 (2000) mainly deals with the dust/moisture relationship and how the Dust Extinction Moisture (DEM) is determined for a particular product. Eq. (1) is used to determine the dust number (dustiness) at a particular moisture content. The dust numbers at different moisture contents are plotted on a log-linear graph as shown in Fig. 4.
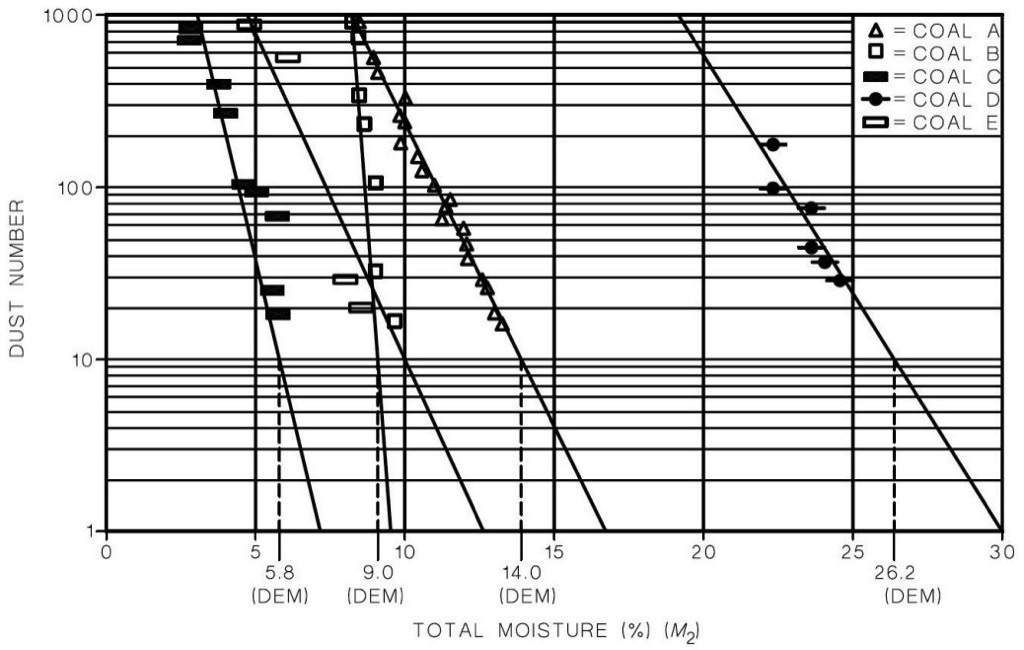
AS4156.6 (2000) describes how an exponential trendline is fitted to the data and used to determine the DEM for the material. The DEM is defined as the moisture at which the Dust Number is 10.
 |
Fig. 4 shows how the DEM can vary significantly for coal, from 5.8 to 26.2% wb (wet basis), and how the slope of the dust/moisture relationship can be quite steep or shallow, depending on coal type. Similar variations in dustiness have been observed for many other different types of bulk material, including iron ore. Such data and trends can have significant effects on dust control efficiency and the amount water needed to control dust emissions (from a product wetting perspective).EN15051-2 (2013) focusses on measuring and classifying the dustiness or dustability of a particular powder sample for workplace emissions, based on the inhalable, thoracic and respirable dust mass fractions. If the Inhalable Dust Mass Fraction (IDMF) is found to be > 3000 mg/kg, then the dustiness of the powder sample is classified as “high”. Although not described in EN15051-2 (2013), it is possible to determine a dust/moisture relationship for a particular powder by simply repeating the test for different moisture contents. Eq. (2) can then be used to calculate equivalence between the two standards.
Based on research conducted to date, some other issues have been identified as possible limitations and/or errors sources of the two current rotating drum tests. Some potentially significant issues are summarised below.
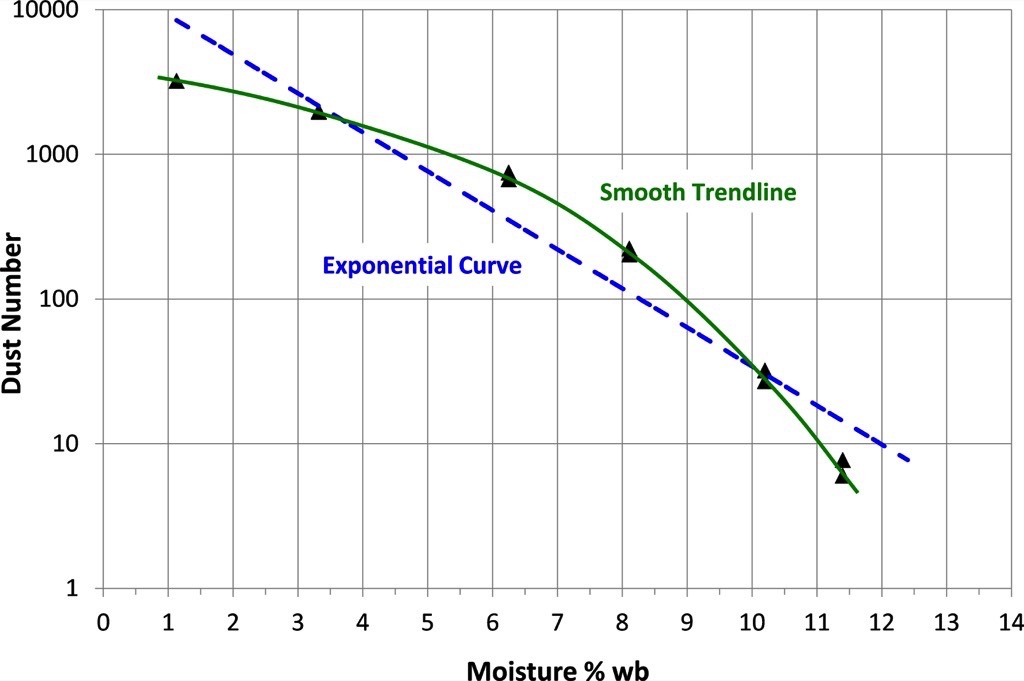
- The exponential dust/moisture curve stipulated by AS4156.6 (2000) does not necessarily occur for all bulk materials and can provide misleading results (see Fig. 5). The DEM for this material was determined to be 12% wb based on the method used in AS4156.6 (2000), however, the DEM was found to be 11% wb based on a smooth trendline. The latter approach appears more accurate and representative of bulk materials in general (i.e. as a better indicator of the actual DEM).
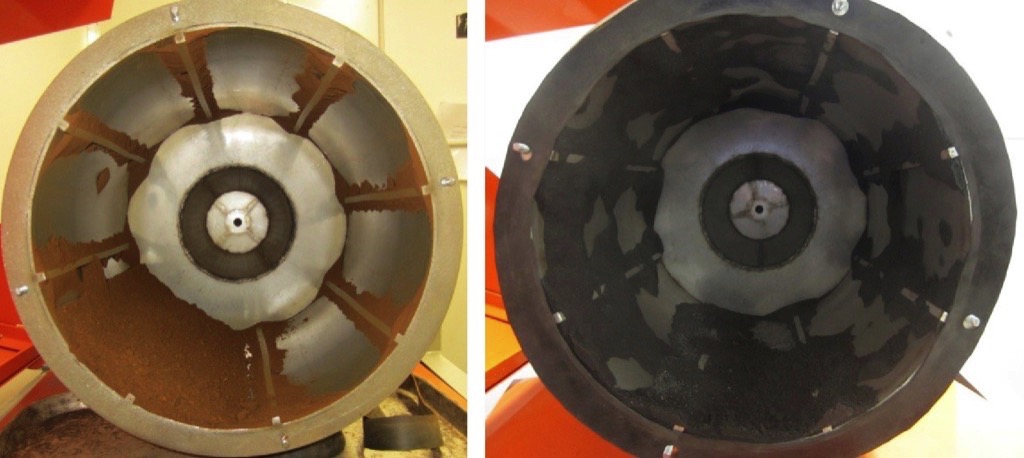
- At moistures approaching DEM, some adhesion of product is noticed on the inside of both rotating drums (Fig. 6). Such adhesion is expected to have an appreciable effect on the results. Alternative “non-stick” materials/liners may need to be considered for the drum. Also, radiused fillets should be used along the full length of each vane.
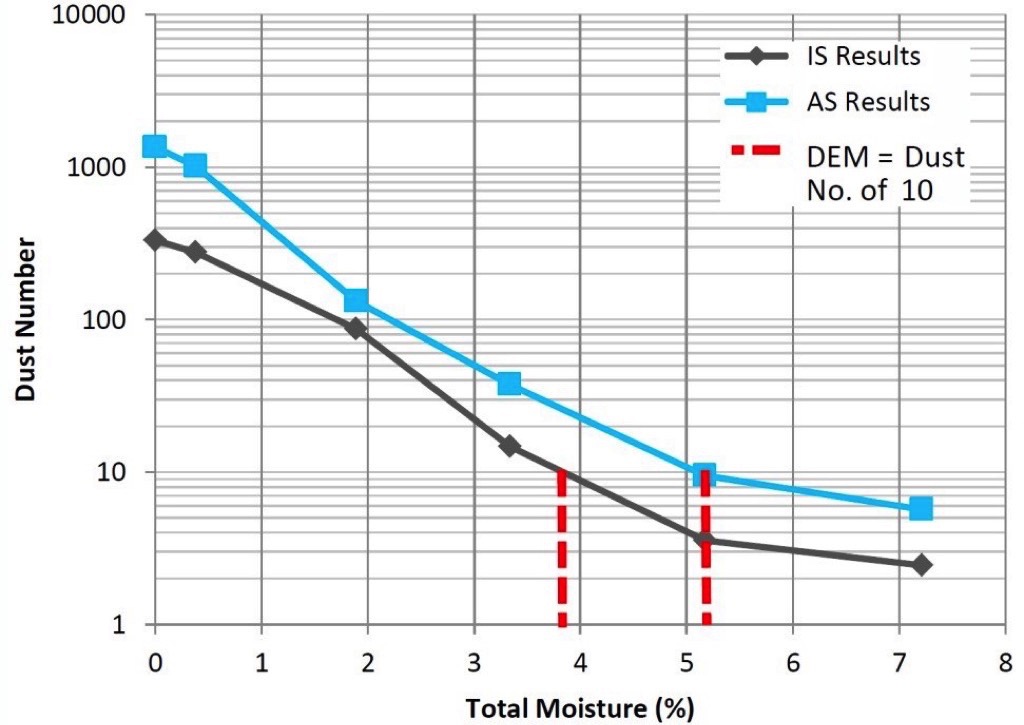
To investigate possible differences between the two standards, “side-by-side” experiments have also been performed. Fig. 7 provides an example of some typical results obtained on ore. The resulting difference in the DEM shown in Fig. 7 indicates a significant difference in the moisture that would be required for dust control. For example, for an application requiring 5000 t/h of ore, the difference in water required would be 70 000 litres per hour.
Some possible key improvements to dustiness testing are being investigated, such as:
- Collecting the dust samples from an AS4156.6 (2000) dustiness test and then determining their Particle Size Distributions (PSD), so that inhalable, thoracic and respirable dustiness mass fractions can be determined (with respect to product moisture). Some preliminary tests’ results are presented in Figs. 8 and 9. It is particularly interesting to see in Fig. 9 how the size of airborne dust particles increases with respect to increasing product moisture.
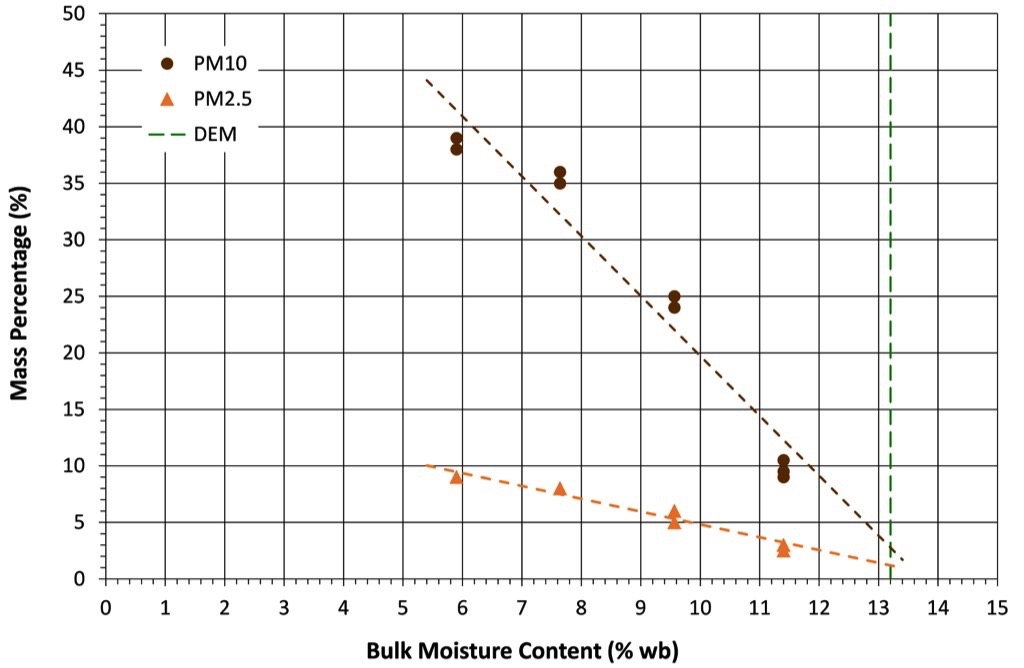 Fig. 8: Variation of PM10 and PM2.5 with respect to product moisture content, for a coal with DEM = 13.2% wb.
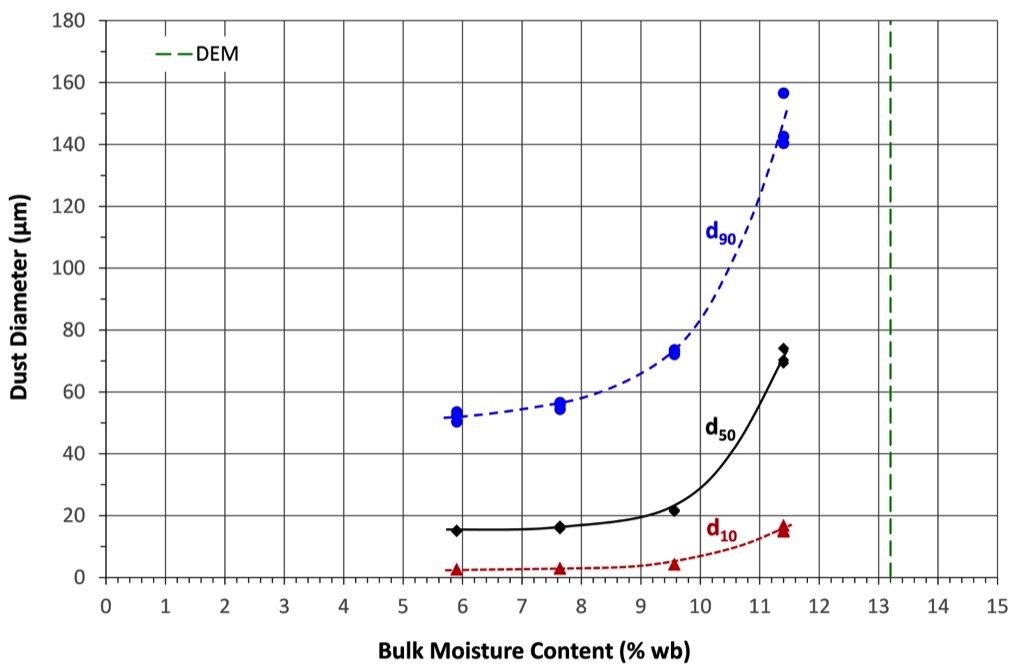 Fig. 9: Effect of moisture content on dust size distribution, for a coal with DEM = 13.2% wb.
 - Re-designing the dust chambers and transfer pipes/tubes to avoid dust deposition, which has been evident in some tests.
- Investigating possible drying of “wet” material (and variable dust levels) during a rotating drum test, especially for AS4156.6 (2000), which requires a running time of 10 minutes. This is a particular concern for products that are known to dry out quite quickly (e.g. concentrates).
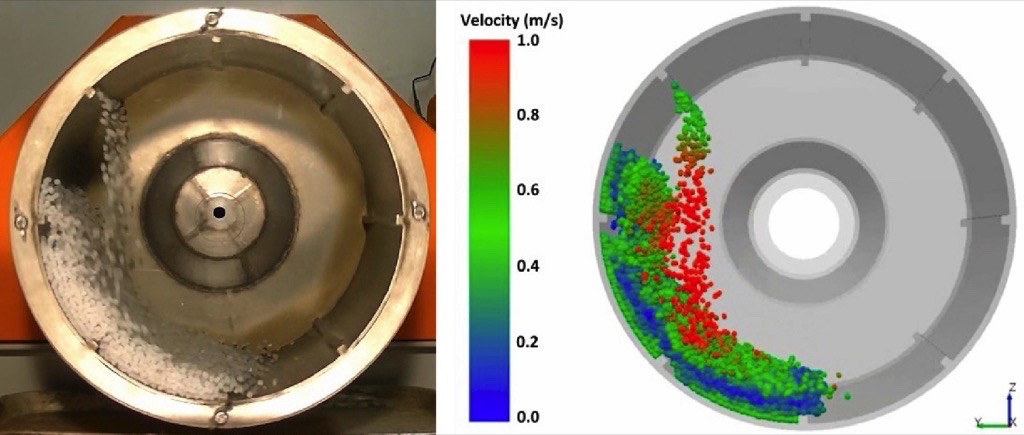
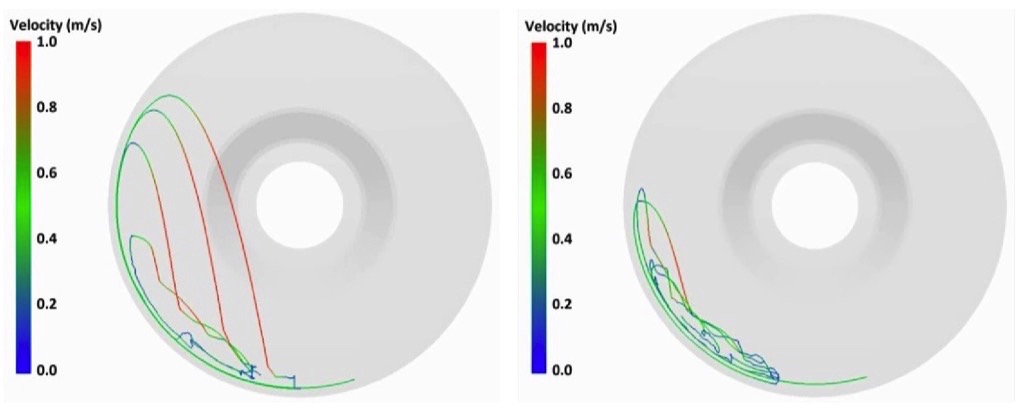
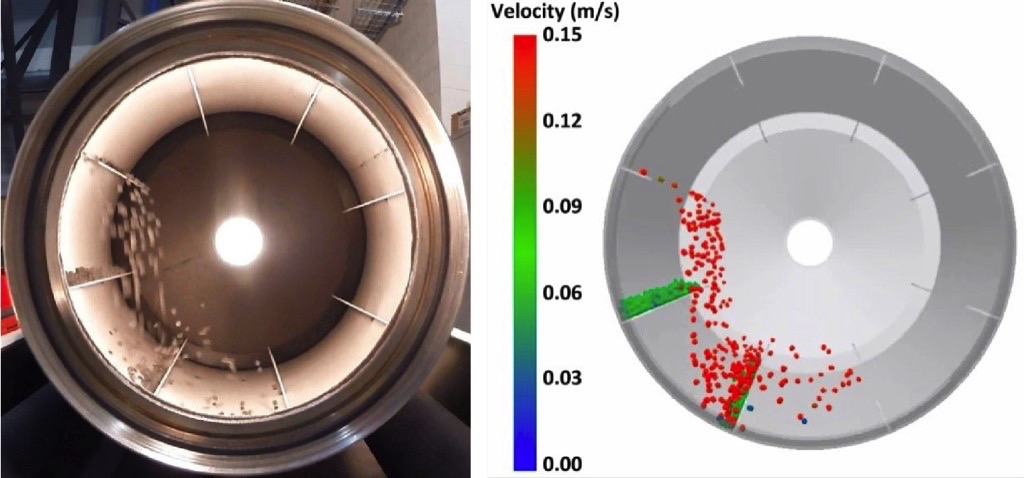
- Investigating possible “system” effects via experiment, DE (Discrete Element) simulation modelling of the particle flows and also coupled DE-CFD (Computational Fluid Dynamics) simulation modelling of the particle-air flows inside each rotating drum. For example, using poly pellets to maximise visibility for high-speed video, a snapshot of a typical experiment based on AS4156.6 (2000) is shown in Fig. 10, which includes a DE simulation based on a relevant calibrated material model (Grima and Wypych, 2011). It can be seen from the DE simulation in Fig. 10 that a certain layer of particles within the rotating sample has an absolute velocity quite close to zero. This could imply that a certain amount of “central” material may not be agitated and exposed sufficiently to the main “extraction” air flow inside the central part of the drum. This could affect the amount of dust released during a test. To examine this further, two particles were selected from the sample and tracked for a period of time during the DE simulation (see Fig. 11). This shows that some particles are well “exposed” to the “extraction” air flow, whereas other particles remain quite “hidden” (due to the “avalanching” or “rotating” nature of flow). In comparison, all the particles moving inside an EN15051-2 (2013) rotating drum tester are expected to be more “exposed” to the extraction air stream – due to the relatively small sample size and also the taller vanes (see Table 1). This can be seen quite clearly in the experimental and DE simulation results given in Fig. 12. To explore these issues further, more experiments and DE simulations are being pursued on both testers (and using other types of bulk material, including iron ore and coal). Coupled DE-CFD simulations are also being pursued currently to investigate particle-air interactions directly.
Such on-going research is being pursued with the overall aim of developing a reliable and practical dustiness tester that is representative of the bulk material sample and contains minimal system effects or operator dependencies.
3. Airborne Dust Suppression
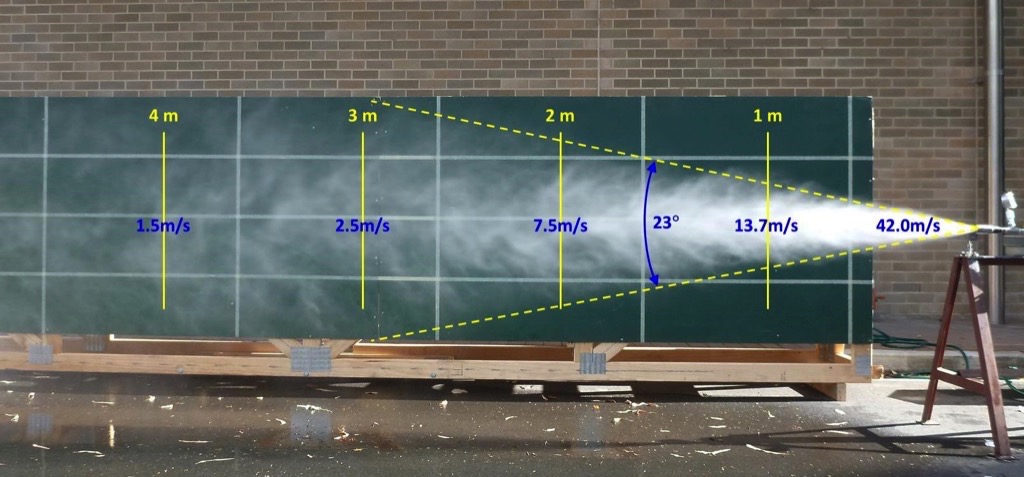
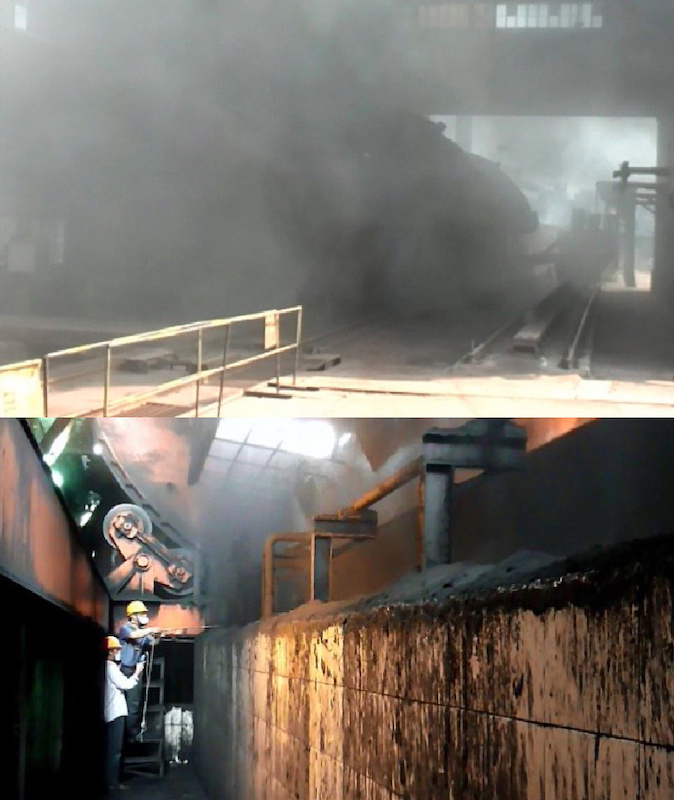
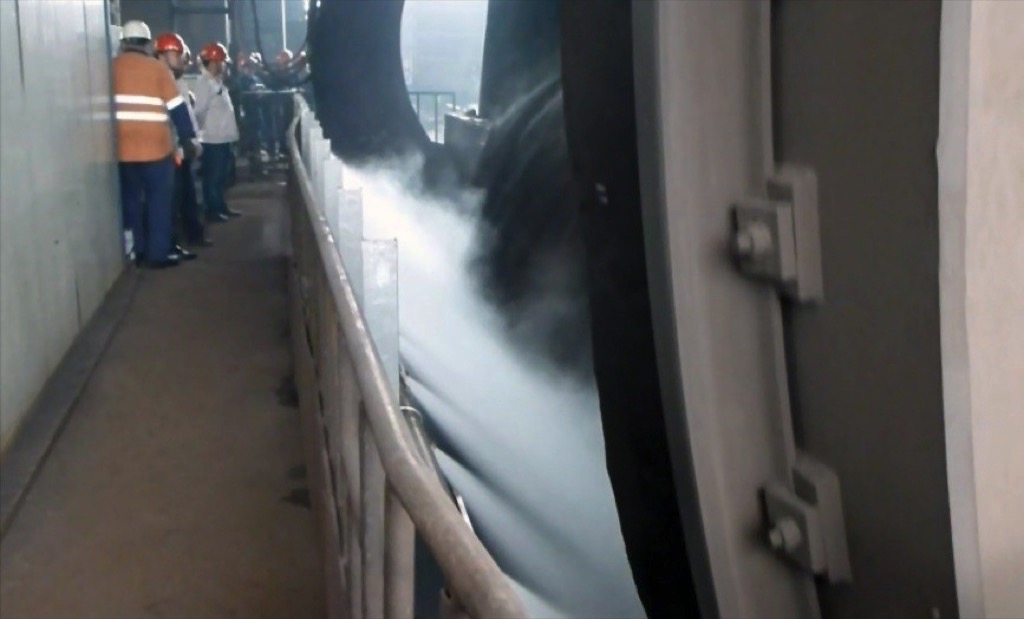
For water spray or misting systems to be effective in controlling/suppressing airborne dust, the mist curtain efficiency and energy need to be matched to suit the product flow rate, the process-driven air flows and any external disturbances, such as cross-winds, moving equipment or obstructions. Other factors that need to be considered for this purpose include: dust PSD and concentration; water Droplet Size Distribution (DSD); nozzle design (e.g. air-water; water-only); water quality (e.g. chemicals, impurities); inertia and momentum of dust particles and air (including “gusts”); inertia and momentum of droplets; dynamic “balancing” of droplets with particle-air mixture; orientation (e.g. plant layout; dimensions).Some examples of results obtained from research into mist curtain efficiency are shown in Fig. 13. This work was undertaken to solve dust emission problems at a rotary rail car dumper, as shown in Fig. 14. The maximum velocity of dust-air flows was measured (see Fig. 14, which also shows an old nozzle header pipe that was unsuccessful in suppressing the high-energy airborne dust).
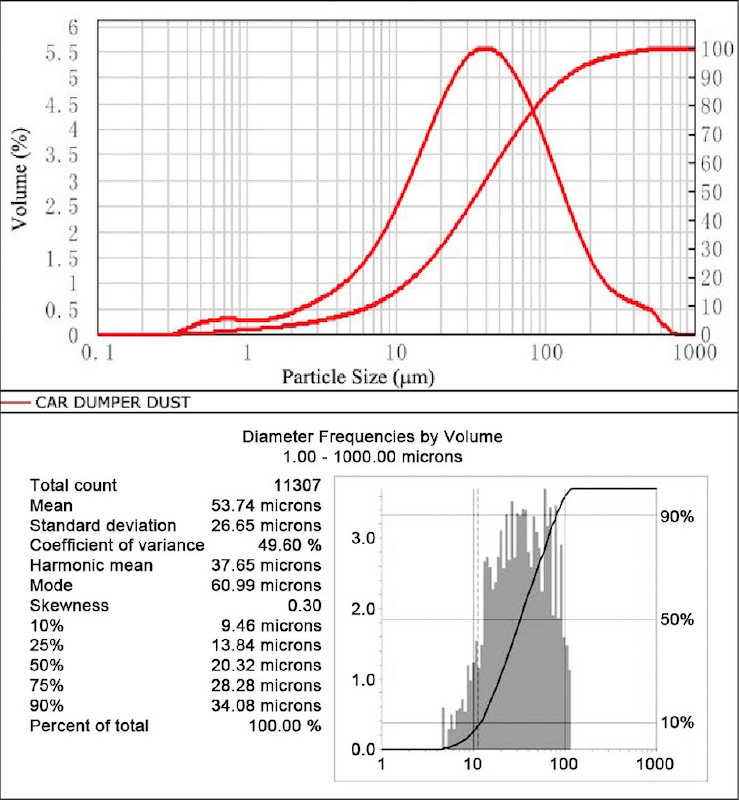
Samples of dust also were collected and the PSD was measured using a laser diffraction analyser (see Fig. 15). A high-energy dry-fogging nozzle was then selected to “match” this application, mainly in terms of air/dust energy and also the DSD, as shown in Fig. 15, with respect to the measured Total Suspended Particulates (TSP).
The resulting high-energy dry fog curtain is shown in Fig. 16, which when compared to Fig. 14 displays remarkably good results. Without the fog curtain, the dust emissions shown in Fig. 14 return immediately – and it is not possible to stand alongside the handrail shown in Fig. 14. This more scientific and engineering approach in solving difficult dust problems in industry is being undertaken via a strategic R&D collaboration with EnviroMist Pty. Ltd. (e.g. conveyor transfers, crushing stations, ROM dump pockets, rotary rail car dumpers and stacker/reclaimers).
Another recent example of this collaborative effort involves solving a significant dust emission problem at a primary crusher ROM Bin, mainly due to truck dumping as shown in Fig. 17 below. An additional problem was the excessive amount of water used by the existing water sprays (up to 1000 litres/min), which were installed to reduce dust emissions. As can be seen from Fig. 17, the existing dust suppression system was not very effective. In some cases, depending on wind direction, the truck became totally consumed by the dust cloud.
Using different nozzle performance characteristics (similar to Fig. 13), a 3D-CAD model was developed for the ROM Bin to optimise nozzle type, size, layout, spacing and mist curtain efficiency. Additional design considerations included cross-wind effects and also reducing water consumption. The final design of the dust suppression system is shown in Fig. 18, which shows special “corner spray blocks” to neutralise the high-velocity dust-air flow coming out of the corner areas of the pit. All the critical nozzles, spray bars and blocks were manufactured in Australia and full-scale “dry” commissioning was undertaken (see Fig. 19) to confirm mist curtain performance and efficiency prior to installation (e.g. cross-wind effects).
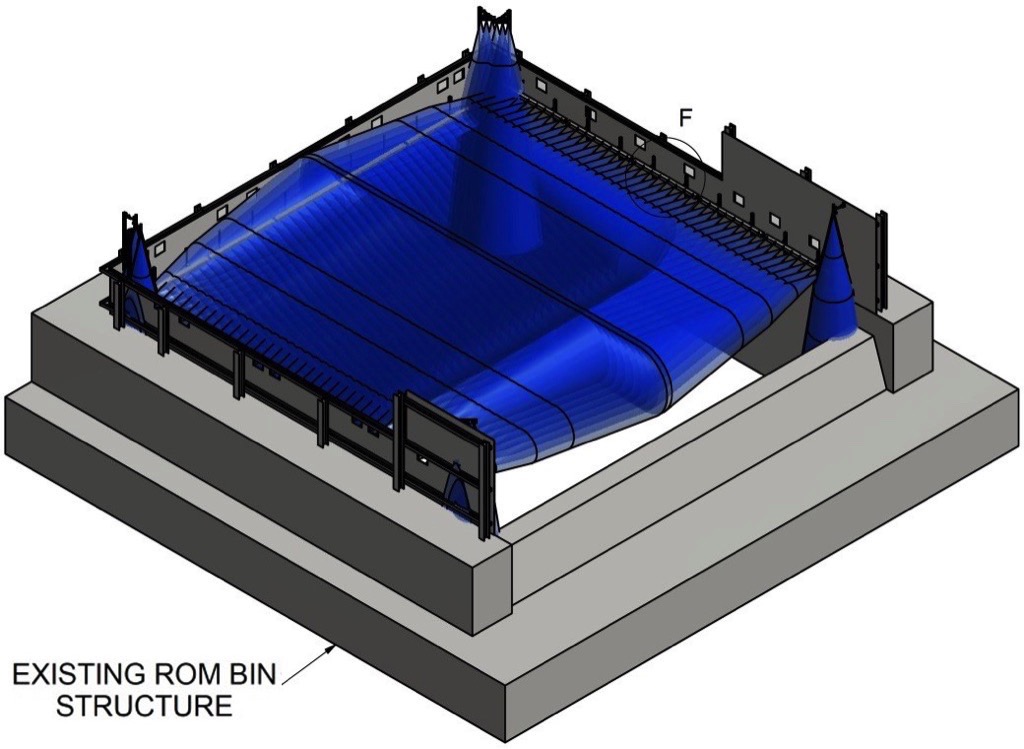
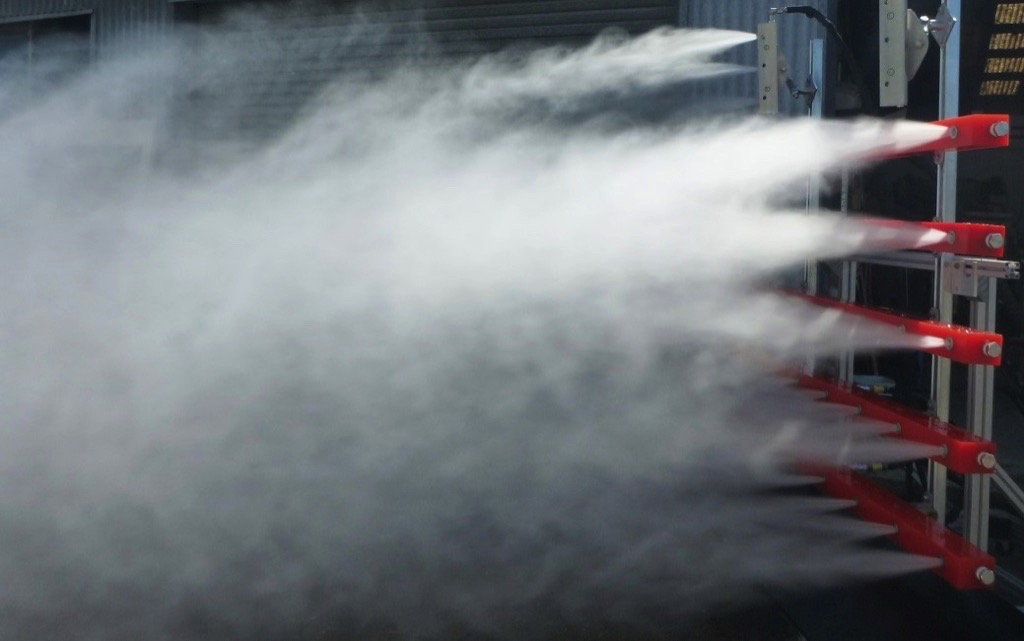
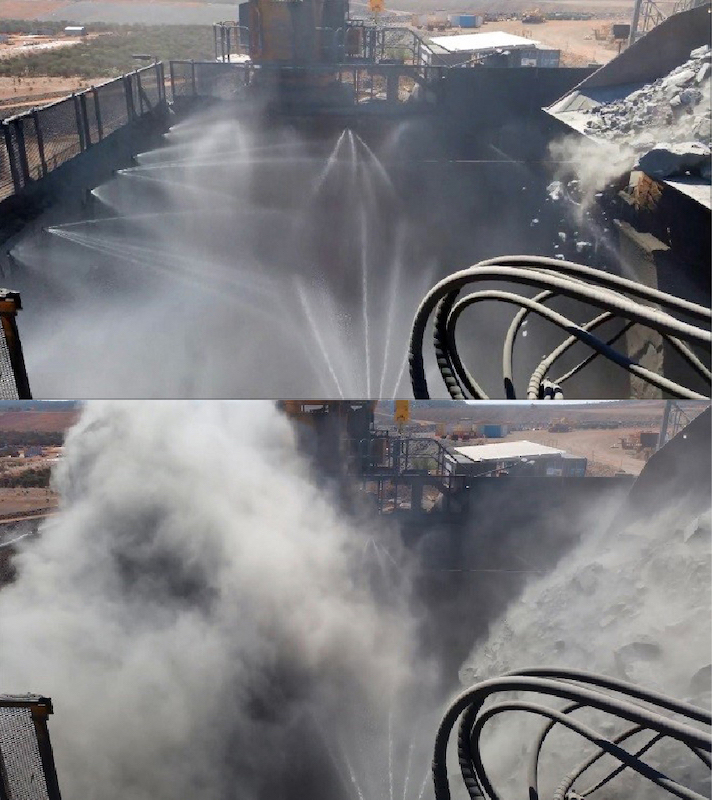
Fig. 20 shows the micro-mist curtain in the ROM Bin during a truck dump operation, and also a close-up of one of the corner blocks in action. No dust can be seen coming out of the ROM Bin, which is a dramatic improvement compared with the quite visible dust emissions shown in Fig. 17. A “side-by-side” comparison (Fig. 21) demonstrates the effectiveness and success of the new dust suppression system. Water consumption also was reduced by over 60%.
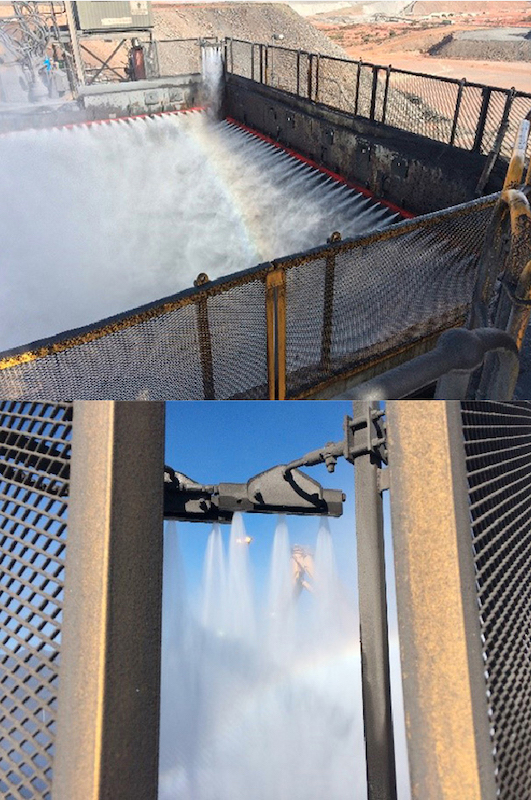 Fig. 20: New Enviromist dust suppression system during actual truck dumping operation, showing micro-mist curtain (above) and special corner blocks (below).
|
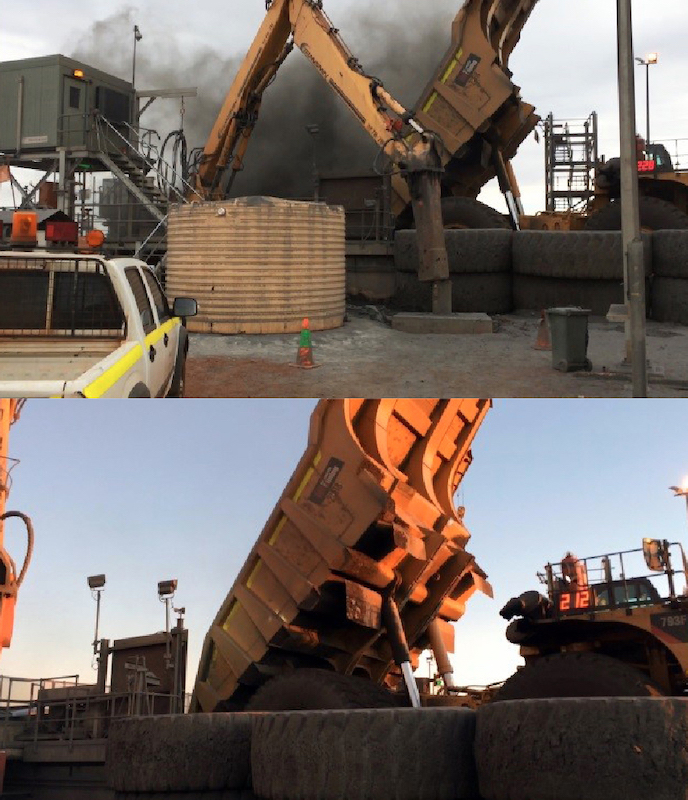 Fig. 21: Comparison of dust emissions with old water spray system (above) and new Enviromist dust suppression system (below).
|
4. Dust Generation Mechanisms
Understanding and modelling dust generation mechanisms will assist greatly in tackling the root cause/s of fugitive dust emission problems. This also will help to optimise and minimise the size and cost of the “final” dust control system needed for a given product and application. The problem depicted in Fig. 22 has been studied experimentally (Cooper and Wypych, 2001; Liu, Cooper and Wypych, 2007), theoretically (Liu, 2003) and numerically (Wangchai, Hastie and Wypych, 2013). The control (exhaust) volume shown in Fig. 22 needs to be greater than the total amount of air generated inside the container (otherwise dust-laden air will be forced back out of the container inlet). Other sources of fugitive dust emission can include dust “peeling off” the main product stream due to: boundary layer turbulence and vortices; and cross-wind effects.The total amount of air “generated” inside the container consists of: interstitial air entering the product discharging from the hopper outlet (due to expanding voidage inside the hopper); air being dragged by the material stream (referred to as induced air); entrained air (due to the expanding voidage of the free-falling stream of bulk material); displaced air (due to particles entering the container). Based on experience and research, entrained air has been found to be most dominant, even for relatively small drop heights. For example, Cooper and Wypych (2001) found that entrained air is proportional to drop height raised to a power of n = 5/3.It is interesting to note CEMA (2007) presents an equation for entrained (induced) air to assist in the design of dust control systems for conveyor transfers. This equation can be simplified to show that the drop height exponent, n = 2/3. This means that doubling drop height will result in a 60% increase in air entrainment (and corresponding control volume). However, based on the experimentally verified value of n = 5/3, a doubling of drop height will actually result in a 220% increase in air entrainment (not 60%). Hence, it appears that CEMA (2007) will significantly underestimate the effect of drop height on entrained air (and required control volume for effective dust control).
5. Conclusions
Fugitive dust emissions from the mining and processing of bulk materials are creating an increasing number of problems for industry, the community and government. Most of the existing dust control measures only treat the “symptoms” of dust generation and can be considered as “protection” technologies. New technologies are being researched and developed to achieve a step-change improvement in solving fugitive dust emission problems for industry, such as: quantification and modelling of the dustiness of bulk materials; new dry-fogging airborne dust suppression systems that can be matched and optimised to suit different applications; modelling of air entrainment processes that contribute to significant dust emission problems.Further work still needs to be done in the area of dust control, including: standardisation of dustiness testing and subsequent determination of dust extinction moisture; research and development of sustainable “total particle” dust suppression technology, where the bulk material is treated at the mine site before being loaded onto trains or trucks; research and development of new high-energy dry-fogging technology that can tackle large-scale applications (e.g. stacker/reclaimers, haul roads); development of coupled DE-CFD models to predict product, air and dust flows for design purposes.
References:
- ACGIH 1988: Industrial Ventilation: A Manual of Recommended Practice; American Conference of Governmental Industrial Hygienists, Inc., U.S.A., 23rd Edition.
- AS4156.6, 2000: Coal Preparation, Part 6: Determination of Dust/Moisture Relationship for Coal; Standards Australia, Sydney.
- CEMA 2007: Belt Conveyors for Bulk Materials; 6th Edition, Conveyor Equipment Manufacturers Association, U.S.A.
- Cooper, P. and Wypych, P.W.: Dust generation and air entrainment in bulk materials handling operations involving free fall of material; in Proceedings AIOH 19th Annual Conf., Wollongong, 1-5 Dec 2001, pp. 29-33, Australian Institute of Occupational Hygienists Inc.
- EN15051-2: Workplace Exposure – Measurement of the Dustiness of Bulk Materials – Part 2: Rotating Drum Method; CEN European Committee for Standardization, Brussels 2013.
- Grima, A.P. and Wypych, P.W.: Development and validation of calibration methods for discrete element modelling; Granular Matter, 13 (2011) 2; pp. 127-132.
- Liu, Z.: Air entrainment in free falling bulk materials, PhD thesis (unpublished), University of Wollongong, Australia 2003.
- Liu, Z., Cooper, P. and Wypych, P.W.: Experimental investigation of air entrainment in free-falling particle plumes; Particulate Science and Technology, 25 (2007) 4; pp. 357-373.
- Wangchai, S., D.B. Hastie., and Wypych, P.W.: The simulation of particle flow mechanisms in dustiness testers; in Proceedings 11th Int. Conf. on Bulk Materials Storage, Handling and Transportation (ICBMH), Newcastle, 2-4 July 2013, Australian Society for Bulk Solids Handling, Australia.
| About the Authors | |
| Vitold RondaVitold Ronda is the Founder and General Manager of EnviroMist Pty. Ltd., (Brisbane, Australia) and involved in development of new generation dust suppression systems. He has also been involved in development and industrial application of products for building, energy and mining industry. His areas of expertise include composite panels, steel fibre reinforcement, dust control and dust suppression equipment. One of the new projects is development of low pressure nozzles for atomizing high viscosity liquids. Vitold has successfully completed a number of dust suppression projects for Vale, Glencore Australia, BHP-Mitsubishi Alliance, Peabody Australia, Caledon Resource, Karara Mining Ltd. and other companies in Australia and overseas. | |
| Prof. Dr. Peter W. WypychProf. Wypych is the Founder and General Manager of Bulk Materials Engineering Australia (BMEA), University of Wollongong and has completed over 500 projects for all sectors of industry, involving R&D, feasibilities, troubleshooting and design of bulk handling plants and processes. He also has been involved with the research and education of solids handling technology since 1981. His areas of expertise include bulk materials handling, conveying, conveyor transfers, computer simulation technology, dust hazards and control, including dust explosions. He has published over 500 articles in these areas, and is the Chair of the Australian Society for Bulk Solids Handling, Engineers Australia. |
■


