(From the archive of ”bulk solids handling", article published in Vol. 32 (2012) No. 2 , ©2012 bulk-online.com)
1. Introduction
Modern conveyor designs rely on predictive and analytical models of indentation rolling resistance of idlers into the belt backing or cover material. A typical belt layup includes two rubber covers with a cord ply or steel cable carcass sandwiched between, with the top cover designed to resist wear and abrasion and the bottom to minimize rolling resistance over the belt system idlers. The indentation of the bottom cover by idlers isa primary source of power loss, and hence an important factor in the design.The particular characteristic of rubber compounds, especially those with carbon black fillers, that produces a nonlinear stressstrain behaviour, even for relatively small strains, is called the Payne effect. This phenomenon refers to a dependence of the viscoelastic moduli on applied cyclic strain amplitude, where it is observed that for strains above about 0.1 per cent, the storage modulus decreases as the loss modulus increases [1-8]. As strains experienced by belt covers, even under modest loads, can routinely exceed 0.1 per cent, and both storage and loss moduli are factors in the indentation loss prediction, it is important to account for the effect of strain amplitude in any predictive model.In this article the measured viscoelastic properties of a typical backing rubber are used and fit that data to an established strain amplitude dependent constitutive model. This model is then incorporated into a one dimensional model of the indentation resistance to show that the indentation loss factor depends significantly on the strain levels and hence the loads carried.
2. Rubber Properties and Characterisation
Since characterisation of nonlinear viscoelastic materials is an extension of the linear theory, first the linear methodology is reviewed. As dissipative materials are inherently time dependent, testing in a cyclic mode at various frequencies is a natural way to capture the time dependence through Fourier analysis. For a sinusoidal strain history of the form ε=ε0·sin(ωt), where ω is the angular frequency and ε0 the amplitude, after an initial transitory state the stress follows the strain in frequency, but at a delayed phase or angle δ. For a linear viscoelastic material, the one-dimensional stress/strain relationship is of the form
| (1) |
with
where σ is the stress, E*(ω) the magnitude of the complex modulus with real and imaginary components E'(ω) and E''(ω), called the storage and loss moduli, respectively. For viscoelastic materials undergoing harmonic deformation, the loss tangent is tan(δ)=E''/E' and is the phase angle of stress following strain.By testing over a wide temperature range but limited frequencies, the superposition principle of linear viscoelasticity allows extrapolation to frequencies or load rates considerably beyond those possible in testing [9,10]. According to this principle, if T denotes temperature and T0 a reference temperature, then a material property at time t and temperature T is equivalent to that at time aT·T and temperature T0, where aT is a shift parameter in time so that aT=aT(T, T0). A commonly used expression for aT, applicable to amorphous materials such as rubbers, at temperatures above the glass transition temperature, referred to as the WLF equation [11], is the logarithmic form
 |
(2) |
where C1 and C2 are constants determined empirically from data. For data taken from cyclical or frequency controlled strain experiments, an empirical representation of the shift parameter aT may be determined by overlaying, through shifts in the frequency, the temperature dependent modulus data onto a "master" curve.Various arrangements of linear mechanical elements of springs and dashpots are classically used to fit the viscoelastic behaviour of Eq. (1).The generalized Maxwell, or Weichert model [9], consists of many such springs (solid) and dashpots (fluid) in parallel with one spring. For such an arrangement of N elements, the storage and loss moduli of Eq. (1) are related to the mechanical element values by the Prony series
| (3) |
where Ei and ηi are the discrete spring and dashpot constants and τi=ηi/Ei are the periods of the various spring/dashpot elements. The Ei values, asa set, are also called the spectrum of the storage and loss moduli of Eq. (3), respectively.As a shear mode of deformation is often used in testing, the equivalent shear storage modulus G'(ω) and loss modulus G''(ω) are convenient to use, instead of the tensile moduli of Eq. (3), with G'(ω)=E'(ω)/3 and G''(ω)=E''(ω)/3, assuming incompressibility of the rubber. A computer program, based on least square curve fitting for shifting and overlaying test data at various temperatures, was written to determine the aT vs. temperature relationship. Also, a least squares fitting process determines constants C1 and C2 of Eq. (2) and a least square, non-negative fitting process determines the spectral values of the moduli of Eq. (3). Here the spectrum is determined by overlaying the storage modulus with spectral values placed at half-decade increments in the frequency space. For a truly linear viscoelastic material, the spectral values as determined from the storage modulus should also reproduce the loss modulus through the second of Eq. (3), and for the low strain data, this is the case as observed below.For dissipative materials like rubber compounds, the macromechanical properties – storage and loss moduli, including the effect of strain – are usually measured dynamically with a DMA (Dynamic Mechanical Analyser). The dynamic moduli are usually determined by testing in a one-dimensional, strain-controlled mode, like uniaxial tension, pure bending or pure shear. Typical tests are performed in a cyclic mode and consisted of sweeps through fixed frequencies of about 0.1 rad/s to about 100 rad/s and at fixed temperatures ranging from about -70 °C to about +70 °C. Pure shear mode is accomplished by twisting a relatively thin and narrow specimen and is generally preferable to tensile or bending modes so as to minimise inertial effects at higher frequencies. This mode of testing also has the advantage of producing a homogeneous strain field within the specimen, which is very important for testing at higher strain levels where all elements of the test cycle through the same strain levels. This would not be the case for bending modes, where the strain level in a bending cycle would vary with distance from the neutral axis.For this study, a specimen (approx. 40×12.5×7 mm) of the rubber material taken from the backing of a typical belt material was sent to and tested by an independent laboratory [12] to determine the low strain and higher strain viscoelastic properties in a twisting, pure shear mode. At low strain levels, testing was performed over a temperature range of -70 °C to +70 °C in about 10 degree increments and over frequencies of 0.0178 to 100 rad/s. Tests were also performed at various strain levels up to 6 per cent at five temperatures and at a fixed frequency of 10 rad/s to characterise the non-linear, strain dependent behaviour.
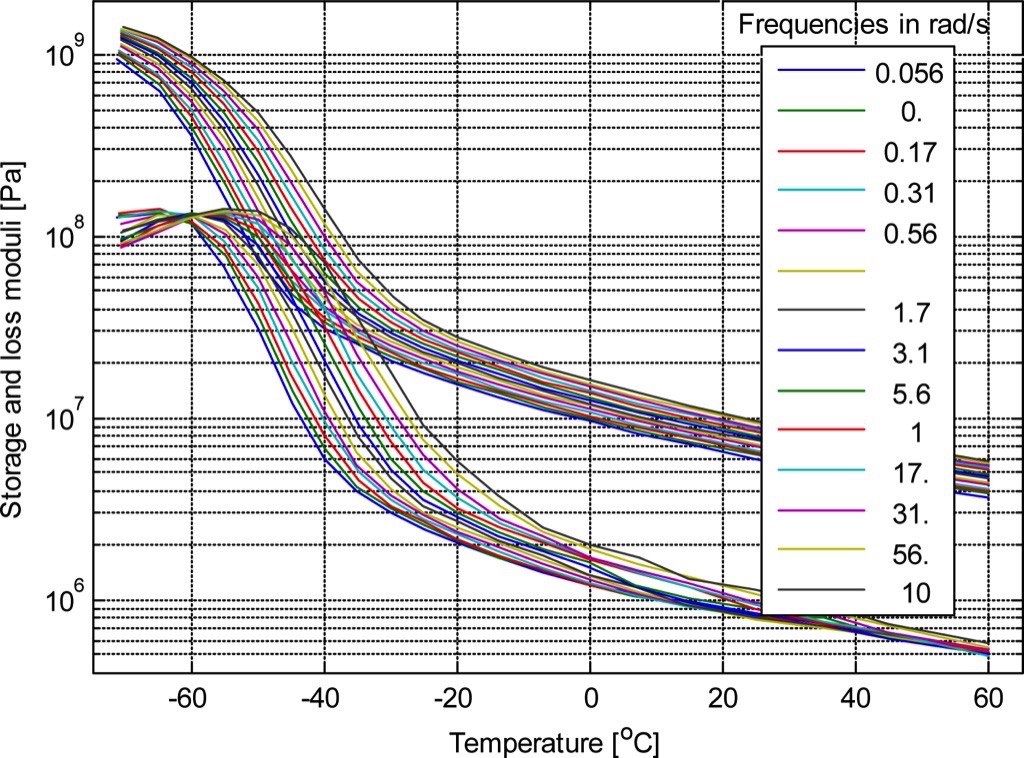
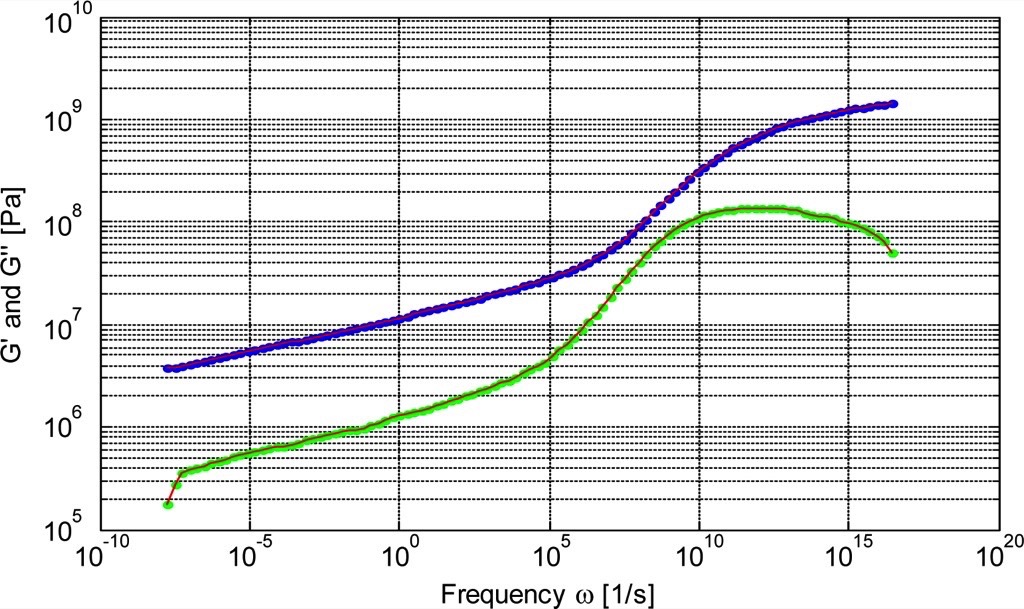
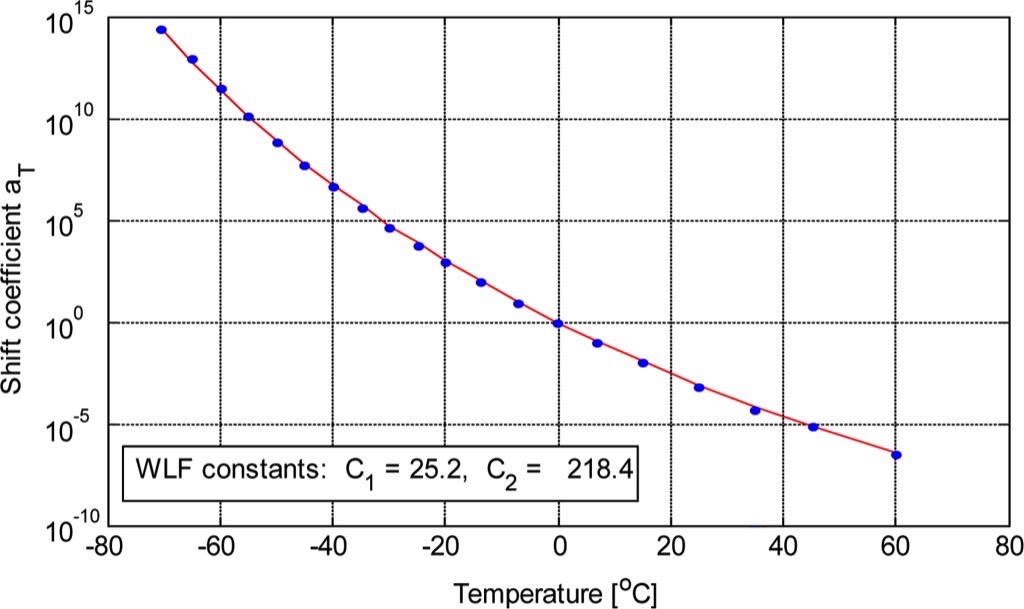
Fig. 1 shows the data of the test for the low strain moduli as taken through harmonic frequency sweeps at fixed temperatures and at strains well below the non-linear threshold (approx. 0.02 per cent). Tests were also made at higher strains (up to 6 per cent) to determine the effective moduli at these higher strain levels as will be discussed in Section 3. Figs. 2 and 3 show the master curves and shift parameter aT for the rubber tested and developed at a reference temperature of 0 °C, which is where aT equals 1 of Fig. 3. Shown also in the table of Fig. 3 are the values of the WLF constants of Eq. (2) for this particular rubber compound.
In addition to the moduli and the shift factor associated with the master curves, an important property directly related to the energy lost in a deformation cycle is the loss tangent tan(δ) = E''/E' = G''/G', which for this material, is readily determined from Fig. 2 and is shown in Fig. 4 as a function of frequency. It is observed that for this material there isa lower plateau of tan(δ) ≈ 0.1 at the lower frequency range (higher temperatures) and peaks at nearly tan(δ) ≈ 0.5 for a frequency of about 108 rad/s. As the rolling resistance is directly related to the energy absorbed by the backing material in the indentation deformation process, the loss tangent relates directly to the rolling resistance. Thus depending on the rate (frequency) and temperature, there could be as much as a fivefold variation in the indentation resistance for this material.

The above ideas pertain to a material characterizsed as a linear viscoelastic one, but can also form the basis fora nonlinear material by determination of approximately equivalent moduli and loss tangent, as discussed in the following section.
3. Strain Dependence of the Moduli
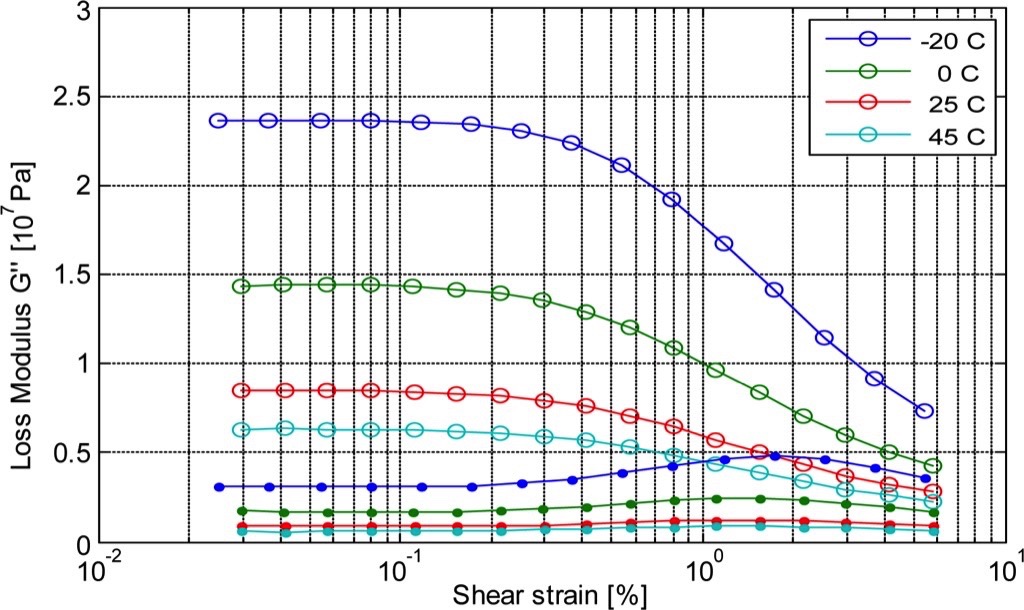
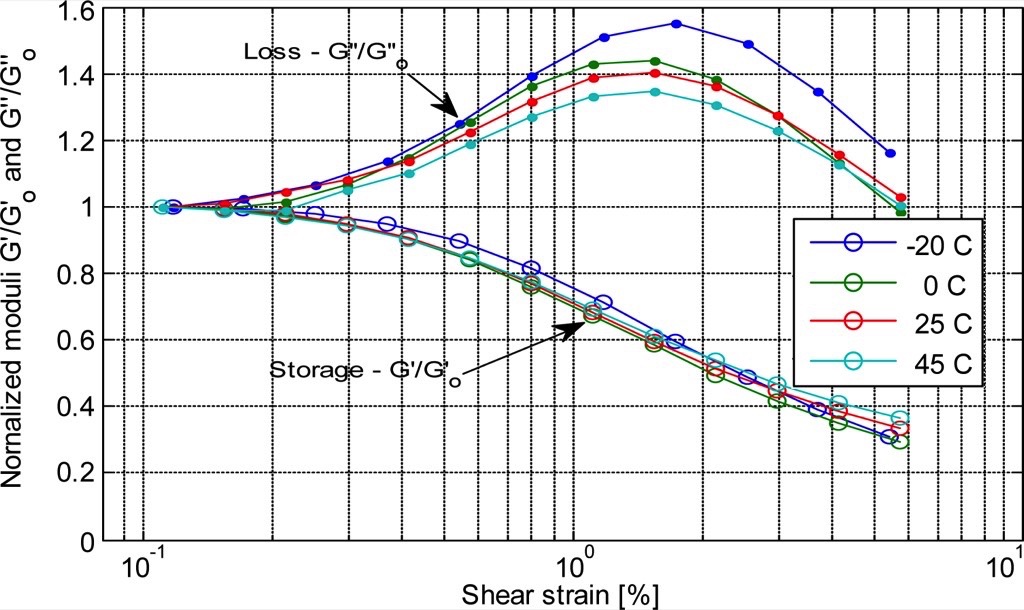
Estimated compression strain levels into the backing material due to indentation can exceed 5 to 10 per cent [13]. At these levels, carbon black-filled rubber compounds are known to exhibit the Payne effect, where the storage modulus decreases significantly with strain amplitude in cyclic, strain applied tests. As such, the linear relationship between stress and strain that defines the moduli in Eqs. (1) and (3) is no longer strictly applicable. Also, in rubber compounds, the loss modulus generally increases with strain amplitude to a maximum at some strain level, and then decreases back to near the low strain plateau as observed in [6,7,8]. To accurately predict the indentation resistance, the nonlinear effects of strain amplitude onto the stress response has to be incorporated into the model of rolling resistance.Kraus’ [14] model of the Payne effect is a nonlinear constitutive equation that has been successfully applied to carbon-filled rubbers, and it is used here since it is easily incorporated into simple models of the indentation and deformation of rolling contact. Kraus’ model is phenomenologically based, but the macro-mechanical behaviour is determined by a small number of parameters that can be gained by one-dimensional, cyclic strain tests.Then, in addition to the frequency/temperature sweeps to determine the low strain moduli of previous section, additional tests were performed on the same material at five temperatures well above the glass transition temperature and at strains ranging from about 0.04 to 6 per cent and all at a constant frequency -10 rad/s. The data (moduli) from those tests are shown in Fig. 5 as a function of strain at the five temperatures. As observed the storage modulus drops by nearly a factor of three from the low strain modulus to that at 6 per cent, while the loss modulus increases slightly within that same strain range. There is also the expected rise in the loss modulus at strains in the range of about 1 to 6 per cent. These test results are similar to those of in [4,6,7,8] and for which Kraus’s model can be readily applied.A normalisation of the data of Fig.5 is first determined by selection of a threshold or reference strain value for which the moduli plateau would be about γ0 = 0.1 per cent. Division of the moduli of each temperature curve by the modulus at this strain, thus defining G'0 and G''0 for each, produces Fig. 6. The figure shows the fairly close overlay of the temperature curves, especially for the storage modulus. As such, it would not be inappropriate to presume that, for such materials, the moduli are nearly temperature, and thus frequency, independent. This is consistent with [6] for carbon filled rubbers, and followed here.
To fit the analytical model of Kraus to the data of Fig.6 we follow the notation and approach described in [7] and [15], where the nonlinear strain dependent moduli, deriving from Kraus’ model, are written in the form
 |
(4) |
where G'0 and G'∞ are the storage moduli at small strains and large strain, respectively, and m is an adjustable parameter. By these equations, the Kraus model isa four-parameter model for each modulus, with the common parameter m. In [5] it is observed that while G'0, G'∞, etc., are fairly well predicted from experimental data in dynamics tests with fixed frequency, fitting data for the storage and loss moduli separately from Eqs. (4) results in different values of the exponent m, and that fitting carbon-filled rubber data to the storage modulus results in a value of the exponent m ≈ 0.1.
Thus in the fitting of these equations to the data of Fig. 6 a different m is allowed for each modulus. Also, to fit the normalised data of Fig. 6, Eqs. (4) are divided by the low strain values and and fit the data to equations of the form
 |
(5) |
where the constants A, B and m are determined independently for each modulus, as well as m. The low threshold strain γ0 = 0.1 per cent is taken to apply to both equations, so there are only three parameters for each modulus – A, B and m.
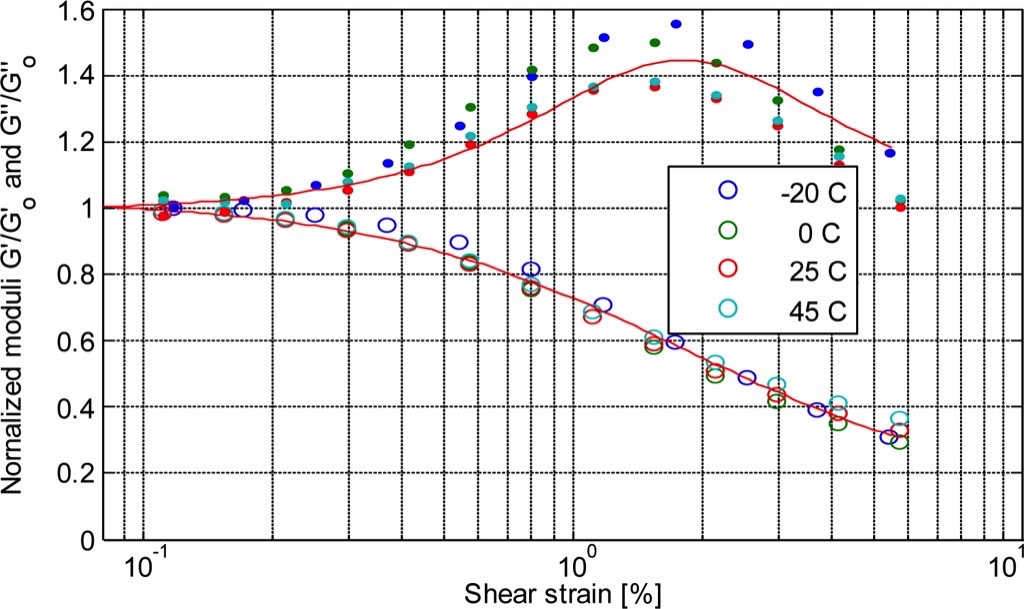
The data of Fig. 6 were fit by a least squares process to Eqs. (5) and Table 1 shows the resulting parameters. It can be observed that m is approx. 0.6 as noted in [5]. Fig. 7 shows the analytical curve fits (red solid curves) of Eqs. (5) for each modulus, overlaid with the data of Fig. 6. The parameter values of Table 1, together with Eqs. (5) and (1) to (3) then constitute a complete one dimensional constitutive model for the material that includes temperature, rate (frequency) and strain level effects. As observed from Fig. 7 the storage modulus decreases to about one third of its low strain value at strains of about 6 per cent. As will be seen, this is a very important factor in indentation resistance.
| A | B | m | |
| Storage G | 0.1261 | 0.8990 | 0.5963 |
| Loss G' | 0.9894 | 0.9117 | 1.3414 |
Also, from a theoretical standpoint, at higher strain levels the assumption of linear viscoelasticity loses applicability and the characterisation of material with parameters as above no longer applies. However, the above model for strain amplitude dependence does assume that, at higher strain levels, the material moduli are scaled up from the low strain level values according to Fig. 7. In other words, at higher strain levels, the material is assumed to be a linear viscoelastic material with moduli determined from the values measured at low strain levels.As a test of how well this scaling holds for higher strains, the same material was tested at a frequency of 10 rad/s and at various strain amplitudes. Fig. 8, shows the results of this test at two strain amplitudes; a low and assumed to be linear strain of 0.1 per cent (green loop) and a higher, and noticeably nonlinear strain of 3.2 per cent (blue loop). At the lower strain level (green) the shape is elliptical while at the higher strain (blue), the Lissajous loop is asymmetric.

Also shown in Fig.8 (red) is the strain corrected loop, as determined by the strain correction modification of the moduli according to Kraus’ model. For this loop, the strain correction factors applied to the modulus G' is 0.427 and for G'' is 1.285, and which change the loss tangent tan(δ) = G''/G' from 0.18 at low strain to 0.54 at high strains; a factor of 3.0. Thus by multiplication of the low strain moduli by these amounts, respectively, and assuming a strain amplitude of 3.2 per cent, the green loop becomes the red loop. In principle, if the material were ideally linear viscoelastic, the red and blue loops would coincide and they would both be scaled up versions of the low stain (green) path with the same orientation of the axes of the ellipse.Finally then, by Kraus’ model, or the strain correction methodology used here, any strain corrected loop will remain elliptical, i.e., the material will be characterised as linear viscoelastic, but with alternate moduli. Since the energy dissipated per unit volume in a harmonic cycle of deformation of a viscoelastic material equals the area enclosed in the stress vs. strain graph, it is evident that this non-linear strain model is an approximation and may somewhat overestimate the energy dissipation.
4. Deformation and Resistance Models
Analytical and computational models of rolling resistance due to indentation of the belt backing by idlers have been developed and, for design purposes, the influence of the main parameters such as idler diameter, carry weight, backing thickness and rubber properties of the backing have been well identified with simple analytical approaches. Simple models that treat the belt covering as a viscoelastic layer on a rigid base are described in [16-18]. A more rigorous approach, with the backing modelled as a full two-dimensional half-space, is presented in [19-22]. All these models assume a linear viscoelastic material of the backing, and as shown in [18], the two-dimensional models provide slightly lower values of the indentation resistance for equal material properties and other system parameters.One can also take a completely computational approach to rolling contact problems, as shown in [24,25], and as applied to belt cover indentation [26], where the cover deforms as a two-dimensional medium and is modelled by finite elements. The advantage of a computational approach is that a less restrictive deformation model is possible, such as modelling the entire belt carcass, as may be important for cable belts where the deformation between the steel cables also dissipate energy (cf. [27]). Conversely, recourse to computational methods at the outset precludes analytical results that can make parameters explicit so that the important parameter studies can be time consuming and expensive. Experimental measurement of indentation resistance is possible, but known to be sensitive due to the low resistance force of efficient belt construction in laboratory setups or inaccessibility issues in field test.The pros and cons of the various deformation models, or the preferred calculation methodology are not the focus here. The primary goal is to show how the nonlinear constitutive equation affects the predicted indentation results. To do this it is only important to use a method where the strain dependent moduli can be incorporated without invalidating the assumption of the model itself. To this end the focus is on the one-dimensional approaches where a simple one dimensional constitutive equation as derived from the test data can be merged directly into the indentation resistance model, as opposed to the two dimensional methods where the strain field produced by a rolling process would be inherently non-homogeneous and require unique strain compensated properties at each point. Instead the focus is only on the models developed in [16] and [23], which is a direct extension of [18] for a multi-parameter material.In the case of [16], the indentation resistance factor f (ratio of belt resistance to vertical load, per unit belt width) is
 |
(6) |
where W is the carry load per unit width, h is the backing thickness, E' is the storage modulus, D is the idler diameter and tan(δ) is the loss tangent. Eq. (8) is revealing in that, apart from showing the explicit dependence of f on the parameters W, h and D, it shows that f is proportional to tan(δ)/E'1/3=E''/E'4/3. Thus if the storage modulus E' decreases and E'' increases, as for materials that exhibit the Payne effect, the rolling resistance will increase directly with changes in both moduli.The formula from [16] in Eq. (8) results from the modeling assumption that the deformation process of indentation is harmonic, i.e., that the material of the backing continuously cycles through a compression phase of indentation, followed immediate by an equal tension phase. The indentation resistance f derives from the energy dissipation of this cyclic process and is thus half the area of the ellipse of Fig. 8 with the strain amplitude determined from equilibrium of the carry load W with the backing stiffness, which requires a short iterative process to effectively determine the indentation depth of the idler, hence strain, for a given W. The assumed harmonic deformation process overestimates the actual case, however, since for steady belt speeds and uniform distance between idlers, the deformation is periodic, but not harmonic cycles as assumed in [16].The method given in [18] circumvents the cyclic deformation process [16] and directly determines the contact stress in the transient compression period of contact between the idler and backing. The rolling resistance then results from direct calculation of the moment of that stress about the idler center, hence equivalent force resisting the motion of the belt. This method [18] has been developed for a simple three parameter material (N=1 in Eq. (3)) and thus is not well suited for realistic rubber materials where tan(δ) is spread over a frequency range as in Fig. 4. The approach presented in [18] has been generalized in [23] by taking the material model to be an n-parameter Maxwell solid while retaining the same deformation assumption of the Winkler foundation. Their formula for the indentation resistance coefficient can be put into a form similar to Eq. (6), and is,
 |
(7) |
where the functions M(Ei, ki, ς) and F(Ei, ki, ς) are defined by:
 |
and
 |
where Ei is the spectral stiffness of Eq. (3), ki=(v/a)·hi/Ei the wave numbers associated with each spectral element, v the belt speed, a+b the contact length and V=b/a, with a being the contact distance ahead of the idler center and b that behind. As with the Jonkers’ formula (Eq. 6), the contact length, hence strain, is determined by an iterative process of equilibrium, given the carry load W, with the stiffness of the backing.Eqs. (6) and (7) provide two different ways to determine the indentation resistance, based on the belt system parameters W, R, h, v and the material parameters Ei and ti. Both can be readily used in conjunction with Eqs. (4) and (5) of Section 3 to allow for nonlinear effect of strain amplitude on the stress response of the backing material. They provide somewhat different results due to inherent assumptions of each, but both are used in the following section as a representative way to show the effects of strain amplitude on the indentation resistance calculation.
5. Influenced of the Strain Level
To show the effect of strain levels on the indentation resistance, the material properties of the tested material and material properties of Section 3 are combined with the two methods of Section 4. In the following calculation, the various belt parameters were taken as: R = 0.075 m, h = 0.00635 m, v = 5.0 m/s, T= 25 °C. W ranges from 50 to 4000 N/m. Since strain in the indentation zone is largely determined by the carry load, results are presented vs. W. Fig. 9 shows the calculated values of f vs. W, using both strain adjusted properties and properties based on small strains.
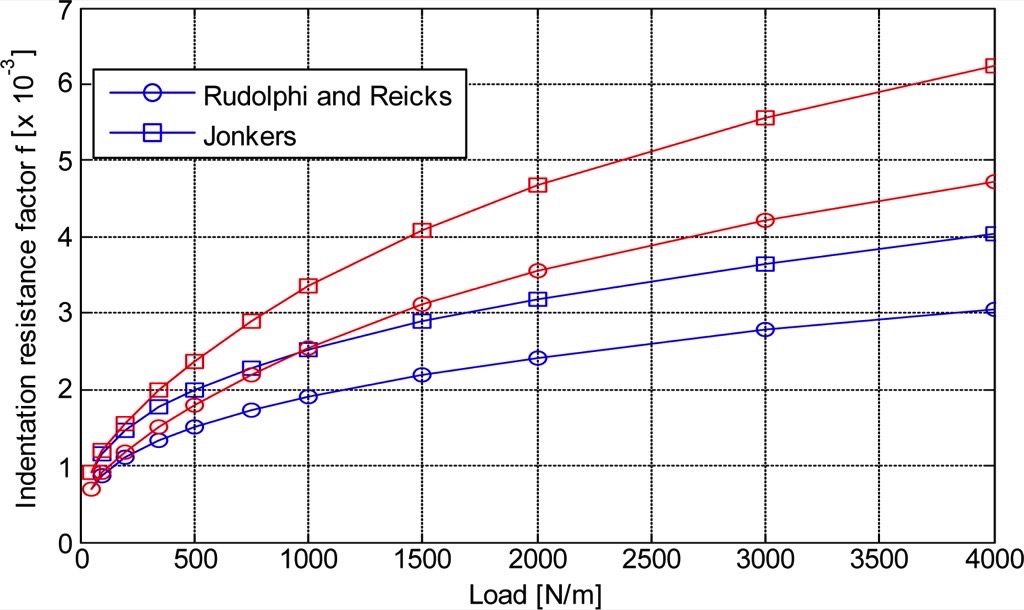
There is a difference in indentation resistance based on the calculation method, but both are magnified similarly with respect to the load W, or strain. The departure from the non-strain adjusted values increases with strain levels, or load, and converge at lower strains. For this particular material, there is nearly a factor of two at higher strain levels, i.e., the strain adjusted properties have a dramatic effect on the indentation resistance calculation, regardless of the methods used to make the calculation. Furthermore, this effect would be expected from Jonkers’ method of Eq. (6) and the effect of strain level on the material moduli (Fig. 7).
6. Summary and Conclusions
As has been long known, the storage and loss moduli of particle filled elastomers, such as carbon black filled rubber as is commonly used for conveyor belt backing material, is dependent on strain levels experienced by the material. Large conveyor belt designs and applications, due to heavy carry loads, strain the backing well beyond the linear strain levels. By using Kraus’ nonlinear constitutive model with measured data fora typical rubber and simple rolling resistance deformation models, we have shown that the predicted indentation resistance is highly sensitive to the material constitutive parameters, or strain level.For the particular rubber properties of a typical belt backing material used in this study, these results would not be unexpected, considering the direct dependence of the loss tangent tan(δ) on the moduli and the strong dependence of the indentation rolling resistance on the loss tangent. Hence realistic predictive methods for indentation prediction should include the nonlinear effects of strain, or values of indentation resistance, hence power required to drive the belt, could be seriously under-predicted.
A Note from the Editor
For all statements in this article that refer – directly or indirectly – to the time of publication (for example “new”, “now”, “present”, but also expressions such as “patent pending”), please keep in mind that this article was originally published in 2012.
References:
- Fletcher, W.P., Gent, A.N.: Non-linearity in the dynamic properties of vulcanized rubber compounds. Trans. Inst. Rubber Ind. 29, (1953).
- Payne, A.R.: A note on the existence of a yield point on the dynamic modulus of loaded vulcanizates. J. of Appl. Polymer Sci. 3 (1960).
- Payne, A.R.: The dynamic properties of carbon black-loaded natural rubber vulcanizates, Part I. J. Appl. Polymer Sci.6 (19), (1962).
- Ulmer, J.D.: Strain dependence of dynamic mechanical properties of carbon black-filled rubber compounds. Rubber Chemistry and Technology 69 (1996).
- Drozdov, A.D., Dorfmann, A.: The Payne effect for particle-reinforced elastomers. Polymer Eng. and Sci. 42 (2002).
- Vieweg, S. et al.: Frequency and temperature dependence of the small-strain behavior of carbon-black filled vulcanizates. Polymer Networks Blends 5, (1995).
- Vieweg, S. et al.: Comparison of dynamic shear properties of styrene-butadiene vulcanizates filled with carbon black or polymeric fillers. J. Appl. Polymer Sci. 73, (1998).
- Wang, M.-J.: The role of filler networking in dynamic properties of filled rubber. Annual Mtg. of the Rubber Division, American Chemical Society, Indianopolis (1998).
- Weinman, A.S., Rajagopal, K.R.: Mechanical response of polymers: an introduction. Cambridge University Press (2000).
- Ferry, J.D.: Viscoelastic properties of polymers. 3rd ed., Wiley, New York, (1980).
- Williams, M., Landel, R., Ferry, J.: The temperature dependence of relaxation mechanisms in amorphous polymers and other glass-forming liquids. J. American Chemical Soc., 77 (1955).
- Harrell, R.: Temperature, frequency and strain dependent viscoelastic property characterization of cured elastomer samples. PolySciCon, (2006).
- Rudolphi, T.J.: Applied rubber belt cover loss prediction from indentation. 2008 SME Ann. Meeting, Salt Lake City (2008).
- Kraus, G.: J. Appl. Polym. Sci., Appl. Polym. Symp., 39 (1984).
- Lion, A., Kardelky, C.: The Payne effect in finite viscoelasticity: Constitutive modeling based on fractional derivatives and intrinsic time scales. Int. J. Plasticity, 20 (2004).
- Jonkers, C.O.: The indentation rolling resistance of belt conveyors -A theoretical approach. Fördern und Heben, 30, 4 (1980).
- Spaans, C.: The calculation of the main resistance of belt conveyors. bulk solids handling, 11, 4 (1991).
- Lodewijks, G.: The rolling resistance of conveyor belts. bulk solids handling, 15,1 (1995).
- May, W.D., Morris, E.L., Atack, D.: Rolling friction of a hard cylinder over a viscoelastic material. J. of Applied Physics, 30, 11 (1959).
- Hunter, S.C.: The rolling contact of a rigid cylinder with a viscoelastic half space. Journal of Applied Mechanics, 28 (1961).
- Morland, L.W.: A plane problem of rolling contact in linear viscoelasticity theory. Journal of Applied Mechanics, 29 (1962).
- Goodier, J.N., Loutzenheiser, C.B.: Moving contact problems of a rigid profile on a viscoelastic base. Division of Engineering Mechanics, Stanford University, Techn. Rep. No. 148, (1964).
- Rudolphi, T.J., Reicks, A.V.: Viscoelastic indentation and resistance to motion of conveyor belts using a generalized Maxwell model of the backing material. J. Rubber Chemistry and Technology, June (2006).
- Lynch, F.: A finite element method of viscoelastic stress analysis with application to rolling contact problems. Int. J. for Numerical Methods in Engineering, 1 (1969).
- Batra R., Levinson, M., Betz, E.: Rubber covered rolls the thermo-viscoelastic problem, a finite element solution. Int. J. for Numerical Methods in Engineering, 10 (1976).
- Wheeler, C.: Analysis of the main resistances of belt conveyors. PhD Thesis, University of Newcastle, Australia, (2003).
| About the Authors | |
| Allen V. Reicks, P. E.Director Research & DevelopmentOverland Conveyor Company, USA | |
| Prof. Thomas J. RudolphiDepartment of Aerospace EngineeringIowa State University, USA |
■