(From the archive of ”bulk solids handling", article published in Vol. 34 (2014) No. 6 , ©2014 bulk-online.com)
Annexe Part A
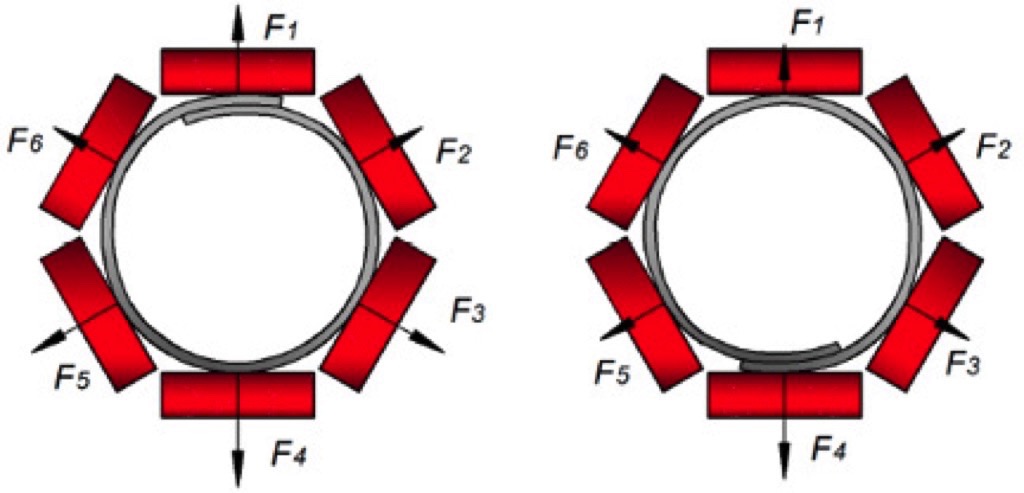
Recently results on pipe conveyor contact forces were presented in Hötte’s experimental study [2]. For the measurements on a pipe conveyor six-point stiffness device, the test rig, designed by the Institute of Transport and Automation Technology (ITA) at Leibniz University of Hannover, was used. The construction became a main basis for the device prototype of Phoenix Conveyor Belt Systems GmbH, introduced in Part A [1]. Hötte [2] described the set-up that also consisted of six hexagon plates, attached to load cells that serve for measuring radial normal forces. All design features, described in Part A for Phoenix test rig, such as replaceable plates of various lengths, adjustable pipe diameter, and sampling rate of 1 Hz with storing data option throughout 24 hours were originally inherited from Hannover test set-up. Impact of friction was eliminated by using talcum and two layers of Teflon® foil paper inserted between plates and external belt sample surface. The measurements were controlled by fulfilling the condition that vertical projection of contact forces gave the total weight of the sample and the projection of the forces in lateral direction had to coincide with the theoretically calculated value.The Hannover six-point stiffness device was also used for imitating lateral loads that appear at conveyor route curves due to belt tension. Hötte [2] proposed a design solution to apply eight concentrated lateral forces on a pipe-shaped belt circumference (see Fig. 2).
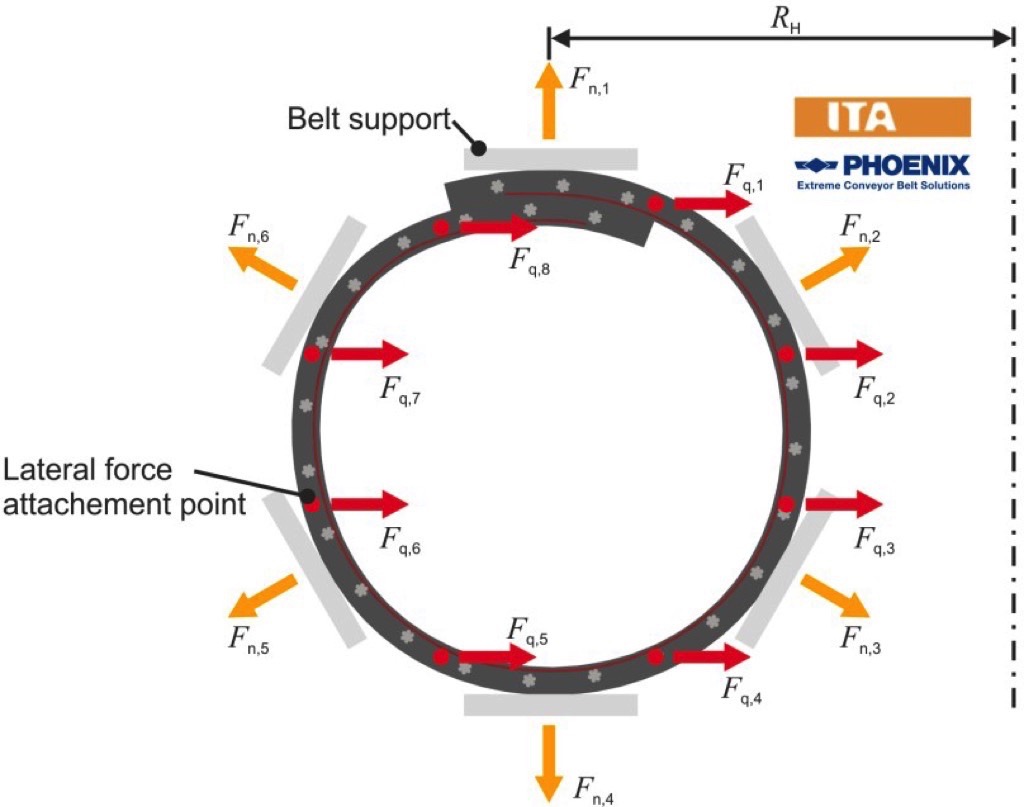
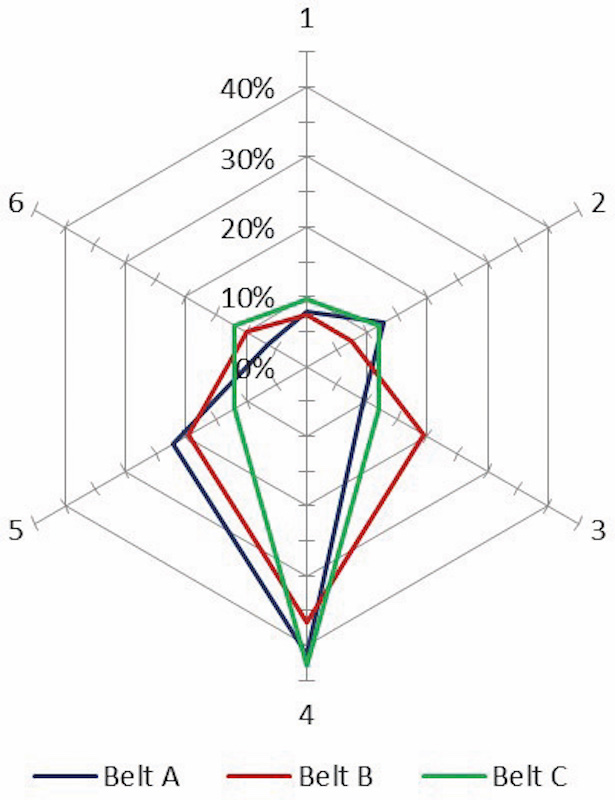
The way these forces were applied to a belt directly (either directly at the steel cords, which remained after the belt sample was stripped from rubber at the edges prior the test or by means of another clamping mechanism) was not specified in the source for the confidentiality reasons. The position of forces application had to be approximately equidistant along the belt contour. The values of loads were calculated based on each point’s circumferential position, hypothetical radius of conveyor route curve Rh in horizontal plane, and also the desired theoretical belt tension and conveyor pitch. The lateral forces were applied symmetrically from both sides of the sample. The way the position of the selected points was measured on the belt contour was not clarified in the source. Hötte presented the results of the measured contact forces between the hexagon plates for loading conditions equivalent to the straight section and by means of eight concentrated forces simulating route curves in horizontal plane from 300 up to 1000 m with a hypothetical conveyor pitch of 1 m and a tension of 300 kN.For the experiment Hötte [2] used three types of pipe conveyor belt samples with 150 mm length, named Sample A, B and C. These samples were attained from belts with the same rating and nomenclature type, but different in structure, used transverse reinforcing materials and also rubber compounds present in belt core and covers. Some of the belt samples properties are given in Table 1.
| Sample N° | Belt type | Belt width[mm] | B/D[-] | Overlap position(see Fig. 2) |
| A, B, C | St 3150 | ≈1925 | ≈3.63 | Top |
Furthermore, the measurements were carried out during a complete 24 hour time period. The researcher reported that during the first two hours results decrease dramatically due to the relaxation effect. After 16 hours they asymptotically reach certain value. For the analysis, Hötte [2] recommended to use averaged results, obtained after 22 hours of the experiment. Fig. 3 illustrates the load distribution between the idler rolls.
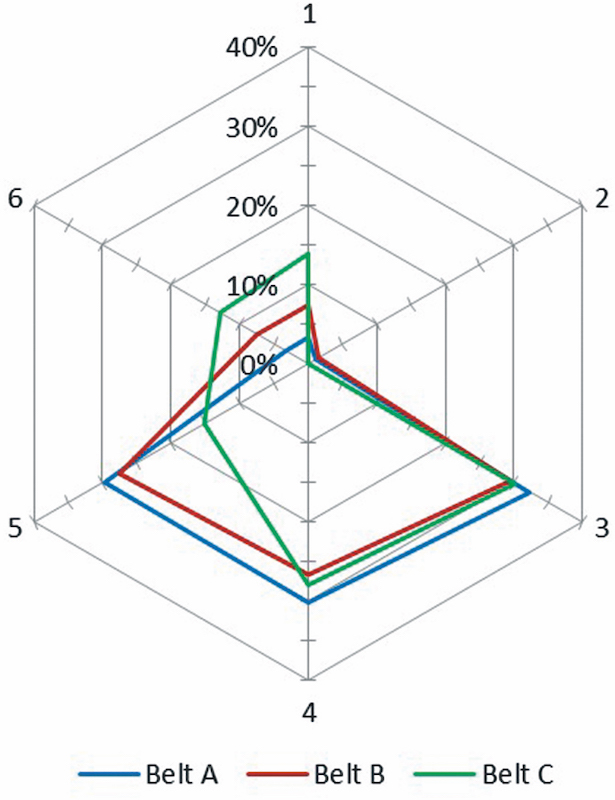
Noteworthy to mention, the researcher reported a remarkable observation, that during the overall 24-hour test, sample C with the higher stiffness showed a larger relaxation percentage decrease of contact forces compared to sample A with lower stiffness. Nevertheless, in absolute values the contact forces of sample C still remain larger than generated results of other samples. This observation has an important significance for the pipe conveyor belting industry and requires further study with a larger number of belt samples.To study the influence of the viscoelastic properties of conveyor belts on the contact forces, Hötte performed tests in an environmental chamber, varying the ambient temperature from -20˚C to 40˚C with 20˚C-steps of increase. The temperature effect on the contact forces was characterized by considering the change of the sum of the contact forces in absolute values |Fn| for each of the samples. The influence of the temperature on each sample load diagram and on each of the contact force was not present in the source.With the six-point stiffness device, Hötte also carried out tests, qualitatively modelling load from bulk material. For this purpose he used an oversized compliant plastic bag as a container filled with water. The hydrostatic pressure was selected in order to eliminate the effect of the internal friction normally apparent in the bulk material. For supporting the container with water placed in the test rig, the cross section of the pipe-shaped belt was sealed with Plexiglas, attached to the test rig frame from both sides with no contact to the belt sample. Additionally, performance of this test required elimination of the friction between the water container, belt surface and Plexiglas seals.In general, analysing the test rig design, it is important to mention that described method of imitating tension induced lateral loads from horizontal route curve, does not provide information about twisting tendency of pipe conveyor belt. Due to reduced length of belt samples, the problem does not reflect the effect of shear stresses, which was noted by Zamiralova and Lodewijks [3], Lodewijks et al. [4] and which can be influential in the phenomenon. Moreover, it needs to be carefully investigated, whether eight concentrated forces in respect to rather large belt width is sufficient to replicate similar loading condition as it happens in practice. Even though the test rig, described by Hötte [2], reflects the hypothetical tension induced by lateral loads, it was not capable to replicate the physical structure behaviour under the action of tensile forces and twisting behaviour of belt at curves. It is important to emphasise that this is relevant for all existing six-point stiffness devices. For considering tension impact on contact forces, static test rigs with frames were used.
1. Introduction Part B
One of the most important indicators of the pipe conveyor performance is how the conveying load from the belt and bulk material is distributed between the supporting idler rolls. Contact forces determine the indentation rolling resistance (see Zamiralova and Lodewijks [5, 6]), which affects the system’s overall energy consumption and ultimately the conveyor installation costs. Form forces also indicate the belt’s tendency to collapse and appearance of the contact loss between the belt and the rolls [7]. A collapsed belt exhibits larger twists and buckling at the route curves. The contact forces also enable the stabilizing rotary moment from the friction between the belt and the idlers, which counteracts the undesirable longitudinal belt twist. That is why it is evident that the contact forces for pipe conveyors are important factors to consider and study.For this purpose, a number of experimental tests were carried out, measuring the load distribution between the idler rolls on various test rigs. The known test set-ups had different configurations and corresponding measurement procedures. Based on the experimental results, the manufacturers can access reliability of their products and the expected pipe conveyor operational behaviour.There is no uniform standard regarding pipe conveyor test rig configurations. Therefore it might be expected that the rig design will affect results of the measurements and eventually may lead to misinforming about the quality of the product. This is especially true, when it comes to the involvement of the viscoelastic behaviour of the rubber compounds that constitute the belt structure. For instance, as studied by Lodewijks [8], even testing rheological properties of the same exact rubber at two independent laboratories with identical DMA rheometers and the same inherent measurement procedures, can yield significantly different results. This shows that the selection of the test rig configuration and the measurement procedure needs to be carefully analysed and controlled when dealing with viscoelastic conveyor belts. This paper aims to present an overview of existent pipe conveyor test rigs, analyse their configuration, draw comparison between, in particular, measured contact forces, and investigate whether the pipe conveyor test rig design influences the results of the measurement.
In order to simplify the comparison, loads measured at different test rigs were adjusted to the certain force numerations and overlap coil orientation. Two cases were implied: overlap on the top and on the bottom (see Fig. 4a and b, respectively). Additionally, each of the presented contact forces was transferred in a value relative to the sum of the absolute values of all the six contact forces (Fn / Σ|Fn|) as a percentage. The rate of overlap was presented as a ratio between belt width and pipe diameter (B/D). The results were supplemented with information about the belt properties, whatsoever was provided in the resource.
2. Static Test Rigs with Frames and Supports
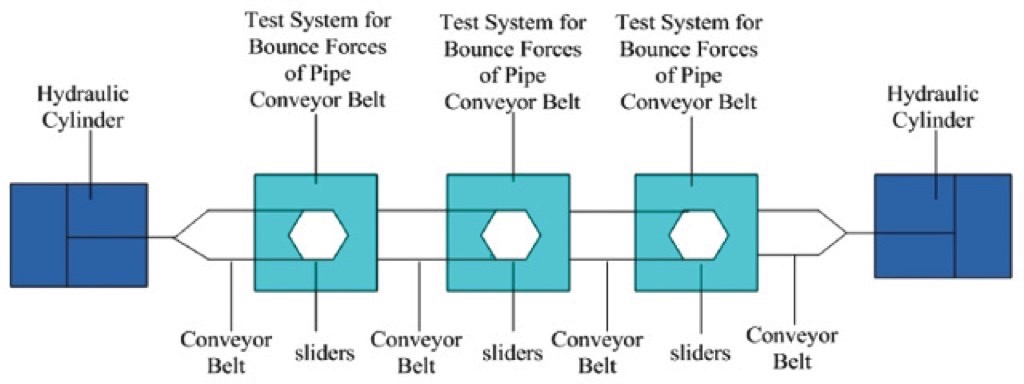
Generally, static test rigs with frames and supports represent a section of a pipe conveyor of the actual size with the required pitch between the idler stations and with a sufficient belt tension. Xiaoxia et al. [9] introduced one of the simplest set-up prototypes, assembled at Taiyuan University of Science and Technology, China. The researchers described the test rig, which consisted of the three six-point belt stiffness devices. These devices supported the conveyor belt forming a pipe shape (see Fig. 5). The tension was applied to the belt by means of the hydraulic cylinders positioned at the edges of the belt. The modelling of the horizontal route curves and variation of the conveyor pitch was carried out by moving the six-point testing devices in a corresponding longitudinal or lateral direction. It is important to emphasise that the procedure to achieve the correct rout alignment can be quite challenging.
In total, three constructions of a conveyor belt (denoted as A, B and C) were tested for various belt tensions and curve radii. The contact forces (shown in Fig. 6) were presented with the similar numeration, as it was assumed in Fig. 4a. However there was no information about the overlap coil direction in respect to the numbers of the contact forces. Also the width of the tested belts, pipe diameter/rate of overlap, belt stiffness, position of the measuring equipment, and conveyor pitch were not reported in the source. Moreover, the data were presented as rounded numbers, and the accuracy of the measurements was not acknowledged in the source.An optional test rig configuration modelling belt tension and route curves could be performed by means of special frames. Delft University of Technology, the Section of Transport Engineering and Logistics performed the experiment measurements on the test rig, built in 2005 by Conveyor Knowledge Information Technology Pty. Ltd (CKIT) in South Africa, Johannesburg [10] (see Fig. 7).The purpose of the measurements was to investigate belt deformation at curves, deflection in between the idler stations, and contact forces on the bottom idler roll at various testing conditions. The experiment was repeated in 2010 for a different belt type on the test rig with similar design construction, explicitly described by Pang and Lodewijks [11] and shown in Fig. 8.
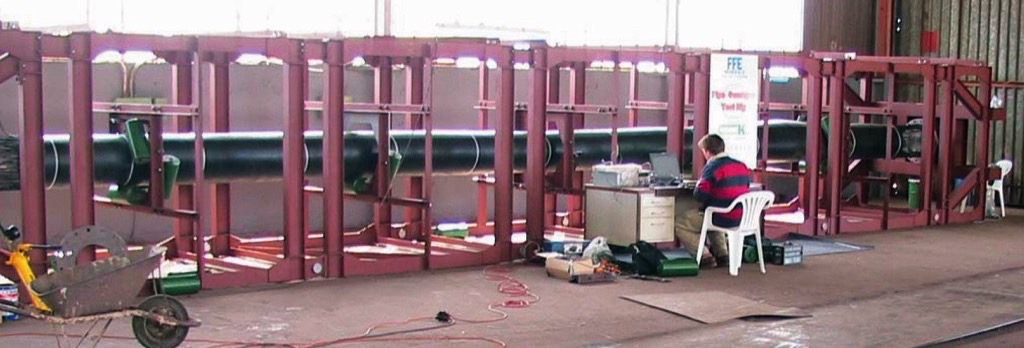
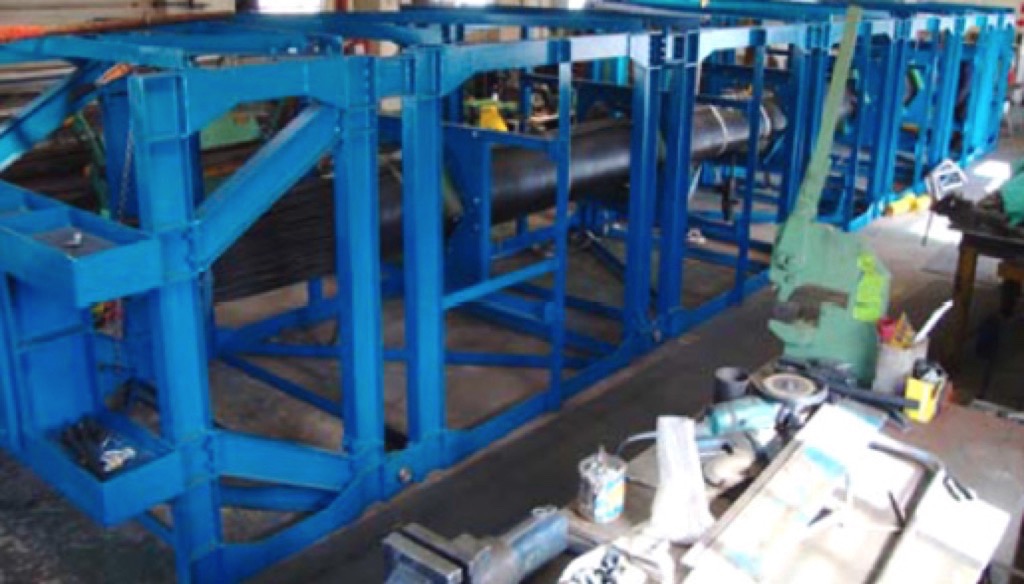
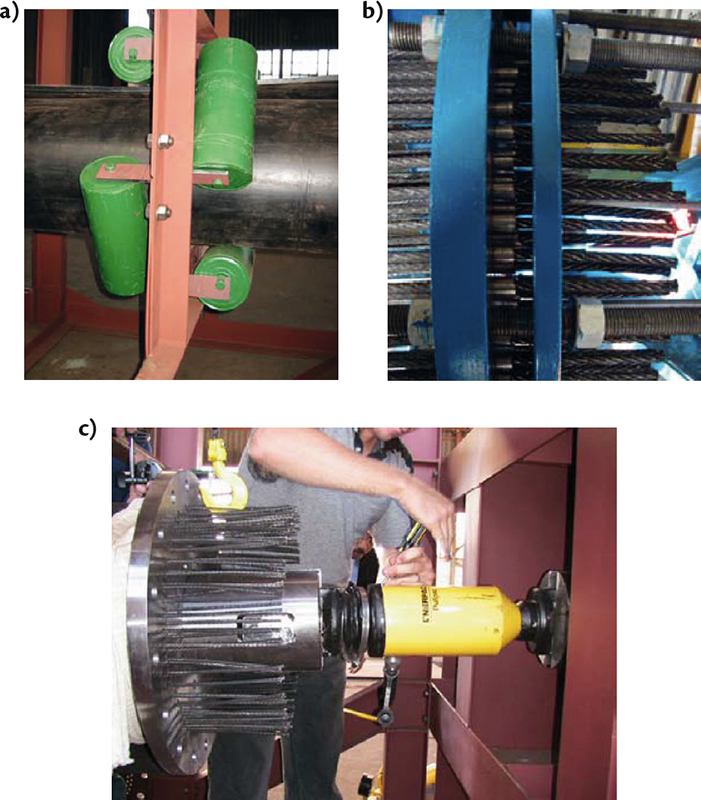
The test rigs used in both experiments consisted of five special frame sections supporting a 12 m long steel cord belt, already formed in a pipe shape. Each section was 2.5 m long and equipped with the hexagon six-roll idler station with double-side arrangement (Fig. 9a).Before placing the belt in the test rig, the belt was stripped at the edges from the rubber, gum, and reinforcing layers. The remaining steel cords were fixed by means of rivets, or conical clamps, into disks at both belt sides (Fig. 9b).One edge disk was fixed to the rig frame and another disk was attached to the hydraulic cylinder (Fig 9c), which served to apply the required tension to the tested belt in a range from 0 to 60 MPa with increase steps of 10 MPa.
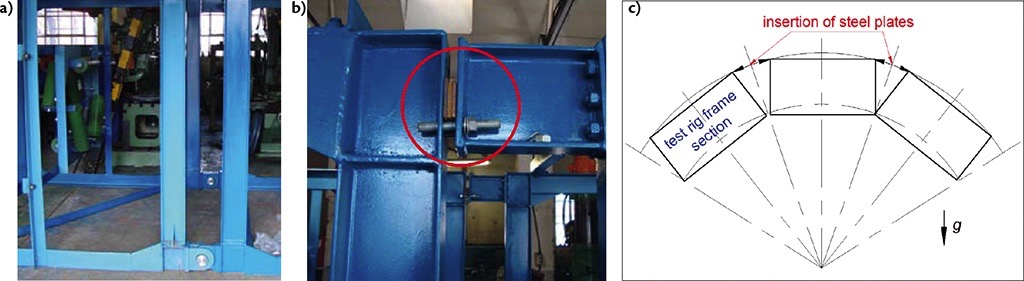
In order to form curves, the supporting frame sections were attached to each other with shafts at the bottom (see Fig. 10a). Additional elements were inserted on the topside and were connected with bolts (Fig. 10b). The curves were modelled in vertical plane by lifting the frames upward with hydraulic jacks. In order to fix the curve, small steel plates were inserted in the gaps between the sections of the frames at the top. The size of these elements corresponds to the vertical test rig curves required (see Fig. 10c).
A steel cord belt St3500 with 1800mm width was used for the experiment. The properties and some corresponding experiment details are presented in Table 2.
| Sample N° | Belt type | Belt width[mm] | B/D[-] | Troughability | Length[m] | Pitch[m] | Overlap position | Tension[MPa] |
| 1 | St3500 | 1800 | 4 | ≈0.33 | 12 | 2.25 | Top; Bottom | 0; 10; 20; 30; 40; 50; 60 |
The measurements were performed at the central idler station, which was equidistant to the rig edges. Two load cells per each of the idler rolls were installed between the frame and the bracket to detect the contact forces in radial directions. The influence of the overlap position on the contact force’s behaviour was carried out by rotating the disks with clamped steel cords clockwise at appropriate angles at both belt edges. Figs. 11 and 12 display the results of the measured contact forces for the straight section of the test rig with overlap at the bottom and at the top, respectively. Results are adjusted to the belt coil and forces numeration, given in Fig. 4.
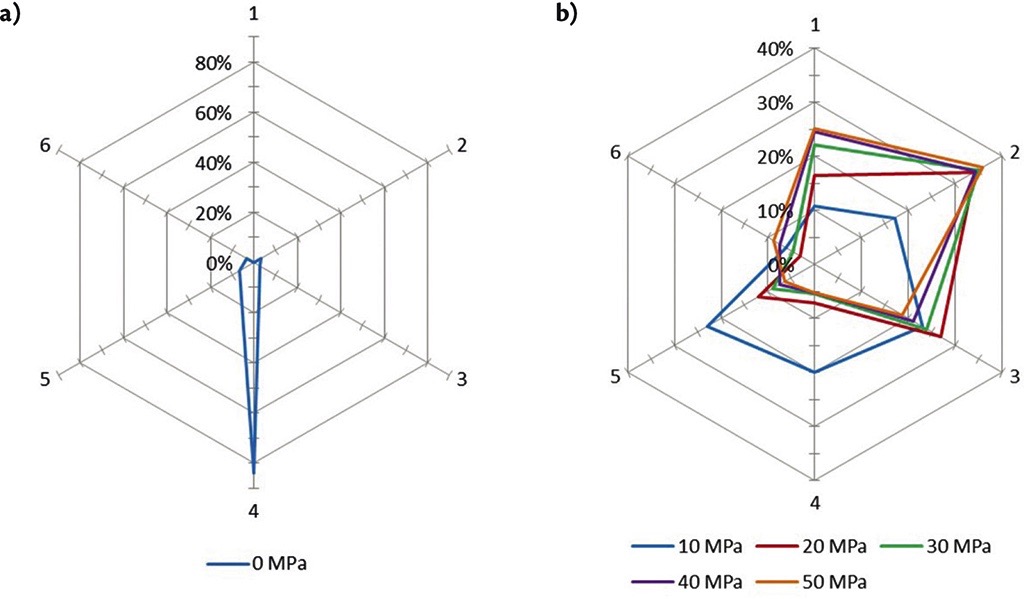
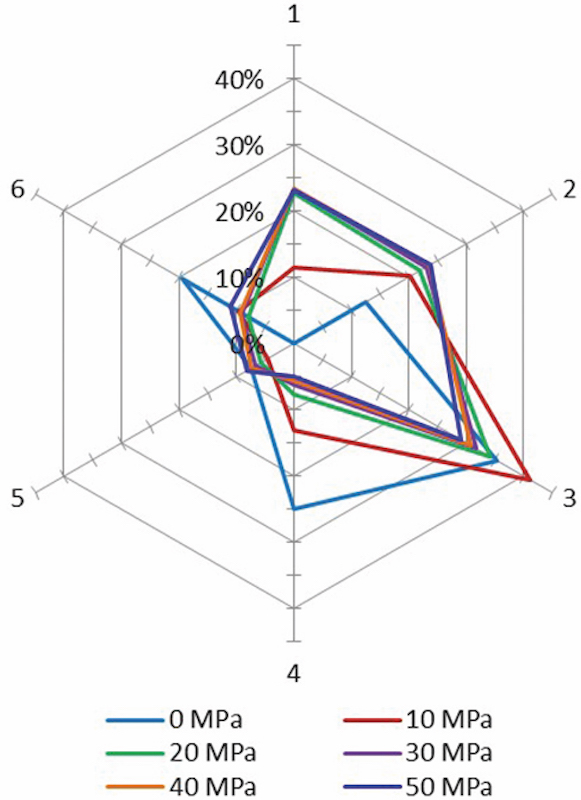
Generally, the analysis of the results shows that the increase of the belt tension causes an increase in the contact forces № 1, 2, and 3 in both relative and absolute values. Without belt tension, the case without overlap shows similar load distribution between the idler rolls, obtained by Zamiralova and Lodewijks [1] via a six-point testing device, however, the case with overlap on the top had a comparative deviation with the results from other resources.The researchers mentioned that the experiment outcome could be affected by the uneven tension in the steel cords, which could appear at clamps during individual cord fixation. Moreover, the belt exhibited rather high transverse rigidity, so when the belt was placed in the test rig by dragging it through the idler stations, it tended to lay more on the lateral bottom idler rolls than on the bottom rolls. Additionally, since the measuring cells sensed the loads only in the radial direction, the impact of the friction forces was not considered and controlled during the test performance.It is noteworthy that for this type of the test rig design it is important to consider the relaxation effect in the tested belt, because it has a great influence on the results, especially in the static tests. During the experiment, it was reported that over time the belt had greater sag between the idler stations and even exhibited dents in some places in direct contact with the idler rolls. This phenomenon implies another significant disadvantage of the test rig: due to its voluminous configuration and excessive time required for placing the belt in the test rig, it becomes almost impossible to eliminate belt deformations, attained from the previous test cases.An alternative drawback of the rig design implies the difficulties inherent to modelling the vertical route curve of the rig by lifting the frame sections with hydraulic jacks and inserting the steel plates on top of the frames. The modelled radii of the vertical route curve could potentially be affected by the vertical sag of the central part of the test rig due to its excessive weight. Moreover, the test set-up was restricted to the curves only at the vertical plane due to its frame connections. The horizontal curves could be arranged if the frames had shaft connections between the sections at the internal periphery of the route curve and additional frame elements with the inserted steel plates at the external periphery of the curve. However, this approach to model the test rig route could not provide the option of testing the curvatures in both horizontal and vertical plane within the same rig design. In addition to the route curves, the test rig configuration had a lack of variation in testing pipe diameter, pitch between the stations, and option to change the idler stations from a double-side to one-side arrangement.Another test rig which was assembled in the Technical University of Košice in the Slovak Republic, and described by Michalik and Zajac [12], Molnar et al. [13-16], Michalick et al. [17] needs to be considered independently from the other static test rigs designed with frames. The particular test rig was assembled to model the transition section of the pipe conveyor, where the belt gradually forms a pipe shape with overlap.
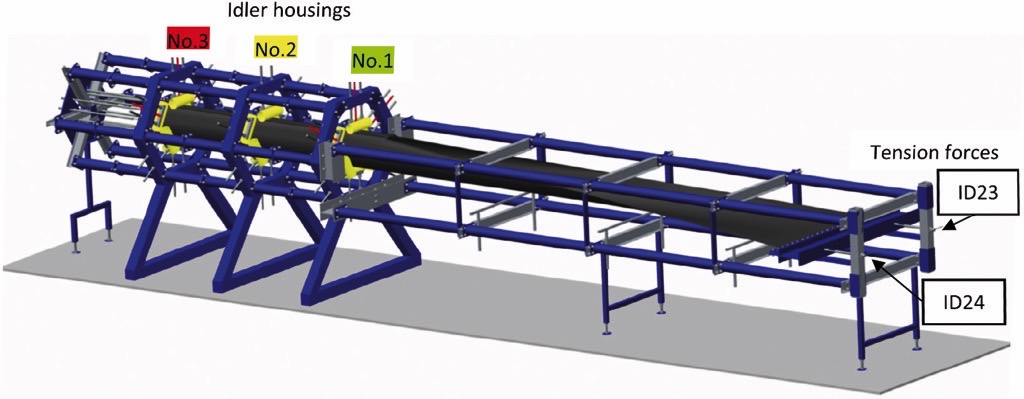
The test rig, illustrated in Fig. 13, consisted of the special frames, forming the belt from a flat shape into a pipe, and three hexagon idler stations (№ 1, 2, and 3) situated at the opposite edge of the test rig, in order to support belt with fully formed pipe shape. Each idler station was equipped with special six static rolls attached to the frames with the adjustable screw rails (see Fig.14a, 14b), modelling the required pipe diameter.
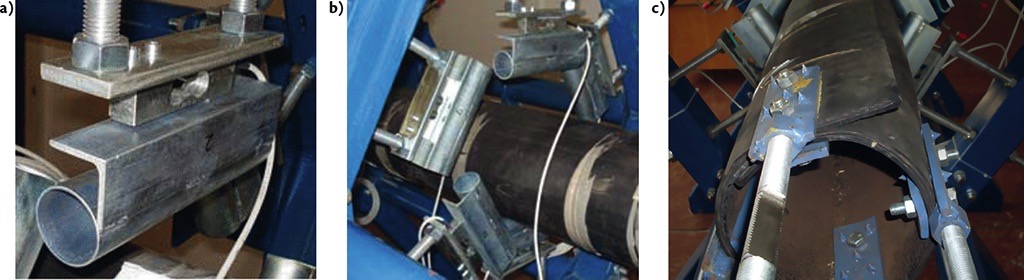
In order to apply tension, the belt was fixed in the test rig with the large flat plate from one side and four plates from another side (Fig. 14c) using tightening bolts. Each plate was attached to the strain gauge with the ball-pin for controlling tension values. The strain gauges were also installed at the hexagon idler stations for measuring contact forces of the full pipe-shaped belt. A fabric belt with 500 N/mm minimum braking strength and total length of 8 m was selected for the experiment. Properties of the tested belt are presented in Table 3.
| Sample N° | Belt type | Belt width[mm] | B/D[-] | Troughability | Young moduli[106 N/m] | Overlap position | Tension[MPa] | |
| 1 | EP 500/3 4/3 D | 800 | 3.2 | 0.333 | Longit. | Lateral | Top; Bottom | 0; 10; 20; 30; 40; 50; 60 |
| 5.567 | 0.453 | |||||||
Belt tension was realized by adjusting two tension screws with ball pins at the large fixating plate. The overall tension varied from 0 to 30 kN, ascending to the maximum value and descending back to zero stepwise. After each tension step-change, the data was stored at time intervals in order to study the relaxation effect in belt rubber compounds. This phenomenon was observed within each interval in gradual decrease of the particular contact forces (see [15]). The maximum recorded time step was around 3.5 minutes [13], though, for better understanding of the phenomenon, the data storage time needs to be extended.It is important to draw attention to the fact that in the mentioned sources [13-15], the numeration of the contact forces and their positive radial directions were clearly specified. It was expected that the values of the contact forces would be positive or equal to zero in case contact loss between belt and idler rolls occurred. However, for certain load conditions, negative values were reported at one of the idler stations, while the same roll position, at a different idler station yielded a positive result. For example, based on the average data provided in [13] for the case when tension force was 2 kN, load of -12.89 N for lateral bottom roll (contact force 3 in Fig. 4a) was detected at idler station № 2. At the same time, the same roll position reported the average force of +50.25 N at idler station № 3. Negative values were even observed at all three idler stations for tension forces between 0 and 4 kN [15]. It is possible to suggest that this phenomenon could be reasoned by either improper sensors calibration, or their plastic deformation, or by errors in the measurement procedure (i.e. some of the rolls were accidentally pressed against the belt due to the incorrect adjustments of their screw-rails).Results with only positive or zero values of the contact forces were selected for the comparison (see Fig. 15a, b), which implied that data were only obtained for idler station № 1 with tension starting from 4 kN and for idler station № 2 with tension started from 12 kN. Growth at contact forces in absolute values was reported with increased tension. In relative values, the increase moved towards the contact forces № 5, 2 and 6. The results, illustrated in Fig. 15, are adjusted to reference Fig. 4a, however the overlap coil orientation was not clearly specified in the source.
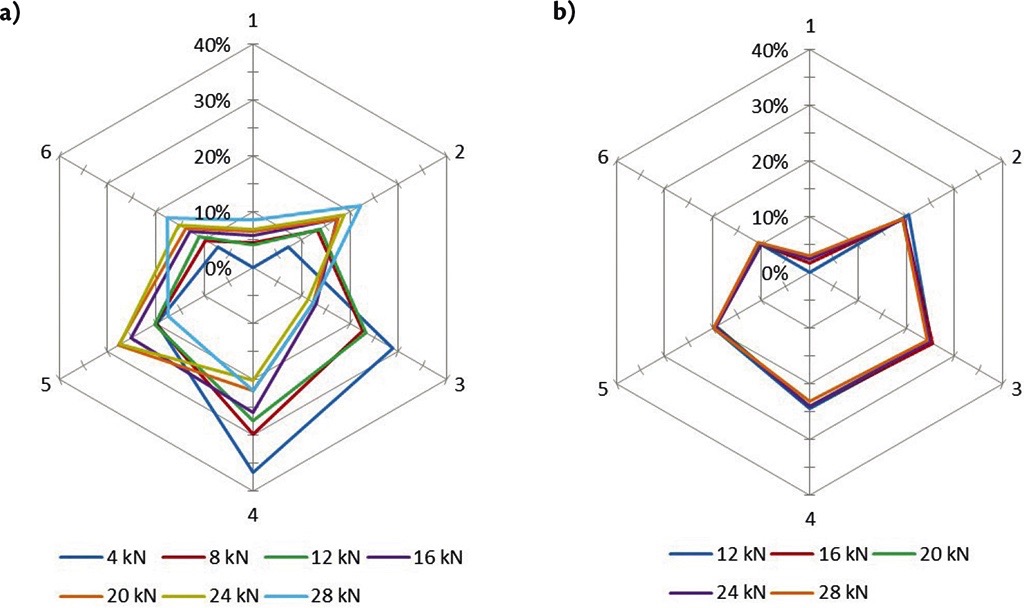
It is possible that the results obtained within this test rig could also be influenced by uneven tension distribution along the pipe belt contour. The fixation of the belt with four plates, shown on Fig. 14c, could cause higher tensile stresses in longitudinal parts of the belt, representing their attachments to the clamps, compared to the parts in between the plates.This phenomenon would not be critical for the results if the measuring equipment were to be installed far enough from the test rig edge with the fixed belt. Otherwise, the load from the nearby to the edge idler stations would be partially carried out by the frames, diminishing measured loads. This proposal is supported by the fact (see the data in [13, 15, 17]) that the absolute values of the contact forces at idler station № 2 are lower compared to station № 1, and higher with respect to station № 3, which is closest to the edge. Moreover, measured loads at idler station № 1 are additionally affected by the close proximity to the transition section shaping the flat belt into a pipe. This test rig configuration is a good example of decisive influence of the design asymmetry and position of the measuring equipment on the experiment results.Most of the test rigs described are relatively reduced in the variation of the tested load conditions and test rig parameters, such as pipe diameter, pitch, idler station arrangement, etc. In order to offer more options for the testing cases within the same experiment set-up design, upgraded test rig formation was offered, designed in cooperation between Phoenix Conveyor Belt Systems and the Institute of Transport and Automation Technology (ITA) at Leibniz University of Hannover [2, 18] (Fig. 16).
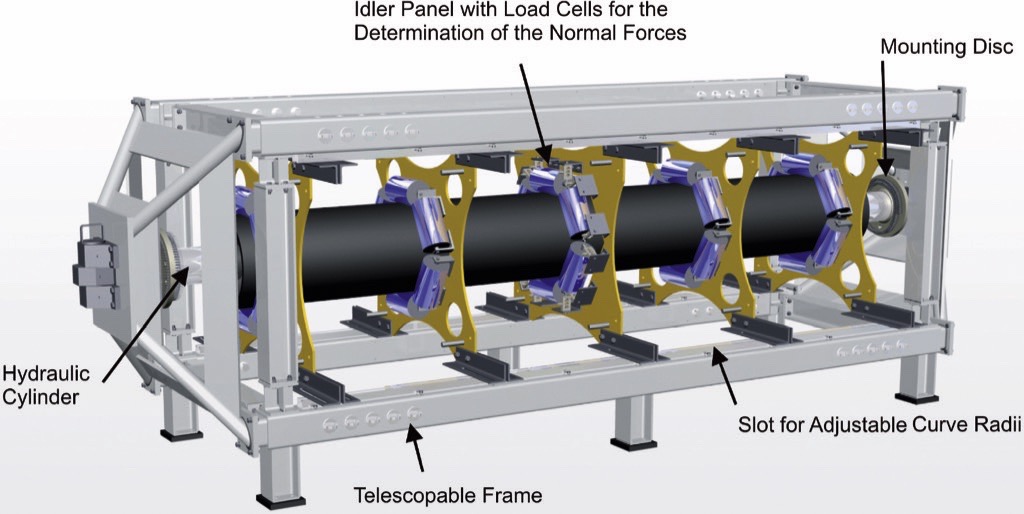
This test rig consisted of the special modular and telescopic frames with five idler stations, which allowed the variation of belt tension, the idler spacing between 1 and 2 m, curves in vertical and horizontal planes with the minimum radii of 50 m, and idler rolls arrangement from one side to double side. The tension was provided by hydraulic cylinders, which were attached to the mounting disks at both edges of the test rig. The cords were clamped to those disks, which had hole patterns for each cord exactly matching the pipe conveyor cross section, designed for specific belt with particular pipe diameter, belt width and even cord pitch. Testing belt samples with different design required also replacement of the cord fixating disks with patterns matching the particular belt structure lay-out. The researchers asserted that the test rig provided the option to control and apply various tension for each steel cord. A Teflon-foil was used at the belt overlap in order to reduce the friction between the belt edges.
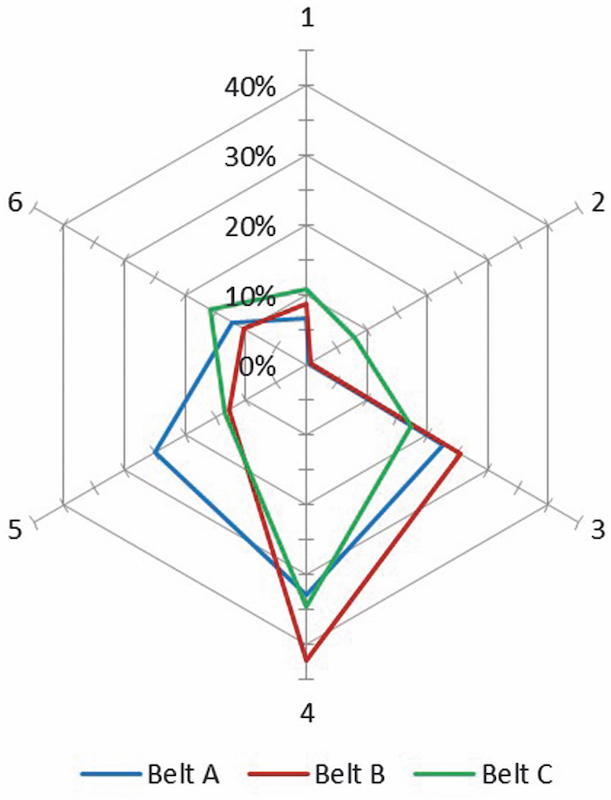
The contact forces were detected by the load sensors installed at the central idler station. The results, preliminarily adjusted to Fig. 4a, represent load case of 300 kN belt tension and are displayed in Fig. 17. The experiments were performed with three samples A, B and C of the same belt types, as used in six point testing device (see Annexe Part A and Table 1). The tension varied from 0 to 500 kN and route curve radii from infinity (straight section) to 200 m.Hötte [2] reported that this test rig was also used for testing the impact of the bulk materials. For this purpose the researcher used a custom made 3 m long tank filled with water. That tank consisted of the flexible and light-weight rubber tube sealed at both sides with the aluminium disks. The external diameter of disks coincided with the internal diameter of belt pipe. For the experiments with such water container, it is important to carefully control membrane stiffness of rubber tube, weight of the disks, friction between the tank and belt internal surface. Moreover, usage of water does not reflect impact of the internal friction, which participates in lateral load component. Bulk material, compared to liquids, transmits shear stresses, and the walls of the container can carry part of bulk weight. In practice, while belt undergoes lateral curves in the route, parts of the bulk material are squeezed and cause higher pressure on the belt surface (passive state), whereas the parts close to periphery of curve generate lower pressures from the passive stress state. However, usage of water eliminates possibility to study these effects, which becomes relevant for all static test rigs.At last, the usage of 1 m conveyor idler spacing in the test rig, brings up the question of whether two idler stations and a minimum distance of 2 m between the measuring equipment at the centre and the belt edges, fixated to the rig frames, showed similar load distribution, as it would be for the same section at the real pipe conveyor installed far enough from the tail and head pulleys, respectively. Alternatively, it might appear that the reported loads could be partially carried out by the frames at the fixed belt edges, as it probably happened at the test rig configuration, assembled in the Technical University of Košice.Despite of these issues, this test rig design occupies more privilege position compared to the other set-up configurations with frames, as it offers more varietion of the testing conditions for the pipe conveyor belts.
Conclusion
In general, the test rigs with frames are applicable to test belt behaviour at the rig, modelling conveyor sections of the actual size with various route curves and belt tensions. Moreover, it becomes possible to observe, whether the belt has a tendency to twist, while it is bended in the frame. The main disadvantages of the design imply voluminous test rig construction, which ultimately results in high installation costs and an excessive time requirement to replace different belt samples. The major positive and negative aspects of the pipe conveyor static test rigs with frames are listed at the end of this paper.It is important to draw attention to the fact that the test rigs described and the corresponding measurement procedures can replicate the belt relaxation response due to the applied tensile forces. However, the mentioned studies paid limited attention to the viscoelastic belt “memory” in the lateral direction due to its static fixation in a folded shape over extensive time. This problem is inherent to the most static test rigs designed with frames. Before repeating the tests, the belt has to be stored flat for a substantial amount of time in order to exclude the deformations from the previous measurements. This becomes impractical due to the voluminous design and problematic process of placing the belt in the test rig. The solution to the challenge is to perform dynamic measurements, investigating how the dynamic effects influence pipe conveyor behaviour. This particular subject in discussing in the following paper Part C. Conclusions, regarding all three part (A, B, and C) of the publication will be presented at the end of Part C.
References:
- Zamiralova, M.E., G. Lodewijks: Pipe conveyor test rigs: Design, application and test results - Part A; Bulk Solids Handling, 34 (2014) № 5, pp. 40-45.
- Hötte, S.: Experimentelle Untersuchungen zu den Normalkräften bei Schlauchgurten; PhD Thesis, Institut für Transport- und Automatisierungstechnik (ITA) der Leibniz Universtät Hannover, TEWISS-Technik und Wissen GmbH, Garbsen, Germany, 2014.
- Zamiralova, M.E., G. Lodewijks: The shear center effect in the twisting of pipe conveyors; Bulk Solids Europe, Berlin, 11-12 October, 2012.
- Lodewijks, G., K.F. Drenth, P.S. van der Mel: Belt Conveyor Technology - Rotation of Pipe Conveyors; Bulk Solids Handling, 30 (2010) 144-148.
- Zamiralova, M.E., G. Lodewijks: Energy consumption of pipe belt conveyors: Indentation rolling resistance; FME Transactions, 40 (2012) 171-176.
- Zamiralova, M.E., K.M.B. Jansen, G. Lodewijks: Indentation rolling resistance of pipe belt conveyors using three-dimensional generalized Maxwell viscoelastic model; 11th International Congress on Bulk Materials Storage, Handling and Transportation (ICBMH 2013), The University of Newcastle, Australia, 2-4 July, 2013.
- Zamiralova, M.E., F. van Keulen, G. Lodewijks: A new analytical approach to calculate the idler roll load distribution of a pipe conveyor; 11th International Congress on Bulk Materials Storage, Handling and Transportation (ICBMH 2013), The University of Newcastle, Australia, 2-4 July, 2013.
- Lodewijks, G.: Determination of Rolling Resistance of Belt Conveyors Using Rubber Data: Fact or Fiction?; Bulk Solids Handling, 23 (2003) 384-391.
- Xiaoxia, S., M. Wenjun, Z. Hui, Y. Yuan, Y. Zhengmao: Analysis on the bending stiffness and the form force of the pipe conveyor belt; Sensors and Transducers, 161 (2013) 655-660.
- Gratama, G., G. Lodewijks, P. Staples: Test results from the pipe conveyor test rig; Report № 2005.TL.6930, Ckit, Johannesburg, Rep. of South Africa, Delft University of Technology, 2005.
- Pang, Y., G. Lodewijks: Pipe belt conveyor statics - Comparison of simulation results and measurements; Bulk Solids Handling, 33 (2013) 52-56.
- Michalik, P., J. Zajac: Using of computer integrated system for static tests of pipe conveyor belts; 13th International Carpathian Control Conference (ICCC), 2012, pp. 480-485.
- Molnár, V., G. Fedorko, B. Stehlíková, Ľ. Kudelás, N. Husáková: Statistical approach for evaluation of pipe conveyor’s belt contact forces on guide idlers; Measurement: Journal of the International Measurement Confederation, 46 (2013) 3127-3135.
- Molnár, V., G. Fedorko, B. Stehlíková, P. Michalik, M. Weiszer: A regression model for prediction of pipe conveyor belt contact forces on idler rolls; Measurement: Journal of the International Measurement Confederation, 46 (2013) 3910-3917.
- Molnár, V., G. Fedorko, B. Stehlíková, P. Michalik, M. Kopas: Mathematical models for indirect measurement of contact forces in hexagonal idler housing of pipe conveyor; Measurement: Journal of the International Measurement Confederation, 47 (2014) 794-803.
- Molnár, V., G. Fedorko, B. Stehlíková, M. Tomašková, Z. Hulínová: Analysis of asymmetrical effect of tension forces in conveyor belt on the idler roll contact forces in the idler housing; Measurement: Journal of the International Measurement Confederation, 52 (2014) 22-32.
- Michalik, P., V. Molnár, G. Fedorko, M. Weiszer: An experimental test rig: For measuring the strength of pipe conveyor belts; Bulk Solids Handling, 33 (2013) 52-55.
- Hötte, S., L. Overmeyer, T. Wennekamp: Form force behaviour of pipe conveyors in different curve radii; Bulk Solids Handling, 31 (2011) 164-169.
| About the Authors | |
 MSc. Maria E. ZamiralovaMSc. Maria E. Zamiralova obtained her Specialist Degree of Science cum laude from Dept. of Mining Mechanics and Transport at Moscow State Mining Univ., Russia, in June 2011 with a thesis about the construction design and development of improved tension calculation procedure for spatially curved telescopic pipe belt conveyor. Currently, she is a PhD researcher at Delft University of Technology on project “Optimal design of pipe belt conveyors” started in September 2011. Her main interests are in bulk handling equipment, belt conveyor technology, pipe conveyor design, optimization and standardization.Dept. of Transport Engineering and LogisticsDelft University of Technology, The Netherlands MSc. Maria E. ZamiralovaMSc. Maria E. Zamiralova obtained her Specialist Degree of Science cum laude from Dept. of Mining Mechanics and Transport at Moscow State Mining Univ., Russia, in June 2011 with a thesis about the construction design and development of improved tension calculation procedure for spatially curved telescopic pipe belt conveyor. Currently, she is a PhD researcher at Delft University of Technology on project “Optimal design of pipe belt conveyors” started in September 2011. Her main interests are in bulk handling equipment, belt conveyor technology, pipe conveyor design, optimization and standardization.Dept. of Transport Engineering and LogisticsDelft University of Technology, The Netherlands |
|
 Prof. dr. ir Gabriel LodewiksProf. Gabriel Lodewijks studied Mechanical Engineering at Twente University and Delft University of Technology, The Netherlands. He obtained a Master degree in 1992 and a PhD on the dynamics of belt systems in 1996. He is President of Conveyor Experts BV, which he established in 1999. In 2000 he was appointed professor of the department Transport Engineering and Logistics at the Faculty of Mechanical, Maritime and Materials Engineering. From 2002 he was appointed as chairman of the department. His main interest is in belt conveyor technology, automation of transport systems, material engineering and dynamics.Dept. of Transport Engineering and LogisticsDelft University of Technology, The Netherlands Prof. dr. ir Gabriel LodewiksProf. Gabriel Lodewijks studied Mechanical Engineering at Twente University and Delft University of Technology, The Netherlands. He obtained a Master degree in 1992 and a PhD on the dynamics of belt systems in 1996. He is President of Conveyor Experts BV, which he established in 1999. In 2000 he was appointed professor of the department Transport Engineering and Logistics at the Faculty of Mechanical, Maritime and Materials Engineering. From 2002 he was appointed as chairman of the department. His main interest is in belt conveyor technology, automation of transport systems, material engineering and dynamics.Dept. of Transport Engineering and LogisticsDelft University of Technology, The Netherlands |
■