(From the archive of ”bulk solids handling", article published in Vol. 34 (2014) No. 2 , ©2014 bulk-online.com)
Introduction
Measuring of the stress-deformation relations that are occurring inside the transport belt, which is applied in the pipe conveyor, is a research subject of many developmental workplaces in the framework of the technical universities. The main reason for performing of the research activities just in this area is a fact that in spite of the several tens installed pipe conveyors worldwide the knowledge base, which is able to describe the contact force relations in the tube conveyor belt, is developed insufficiently even now. There were published various studies based on the theoretical analyses predominately, which are supported sometimes also by a computer simulation using FEM.The theoretical results create an important information base, however, taking into consideration the practical application point of view, they require also a real verification and validation. From this reason the future development of research aims to approach the reality and typical operational conditions.The measuring possibilities at the real operating pipe conveyor are very complicated [1][2]. The conveyor is usually installed in the given technological complex without a possibility to be excluded. Also, the real operational conditions of the pipe conveyor are not suitable for application of the very sensitive measuring apparatus [3].Thus, the survey effort of the researchers is oriented towards performing of their measuring experiments in the laboratories equipped with the installed special measuring and testing devices that are able to simulate the real operational conditions as close as it could be achieved [4].One of such experimental equipment was developed at the Faculty of Mining, Ecology, Process Control and Geotechnology, Technical University of Košice [5], [6] and nowadays it is exploited very effectively. This laboratory apparatus is designed so that it represents the 8 m long section of the pipe conveyor, in which the conveyor belt is transformed to the pipe form.
1. Measuring of Stress-Deformation States in the Transport Belt of the Pipe Conveyor
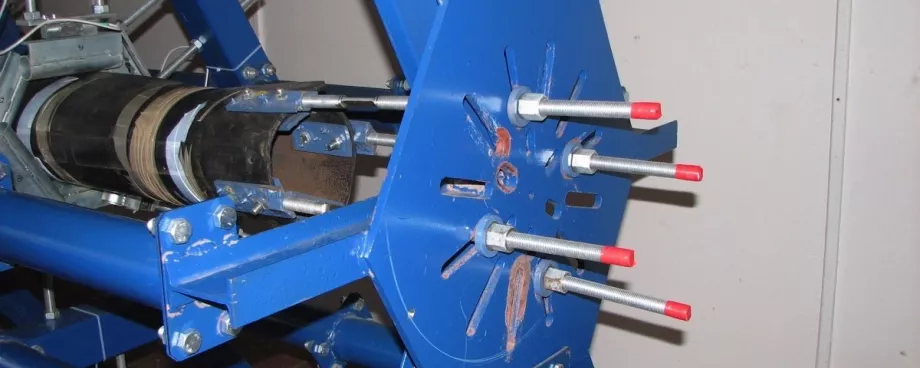
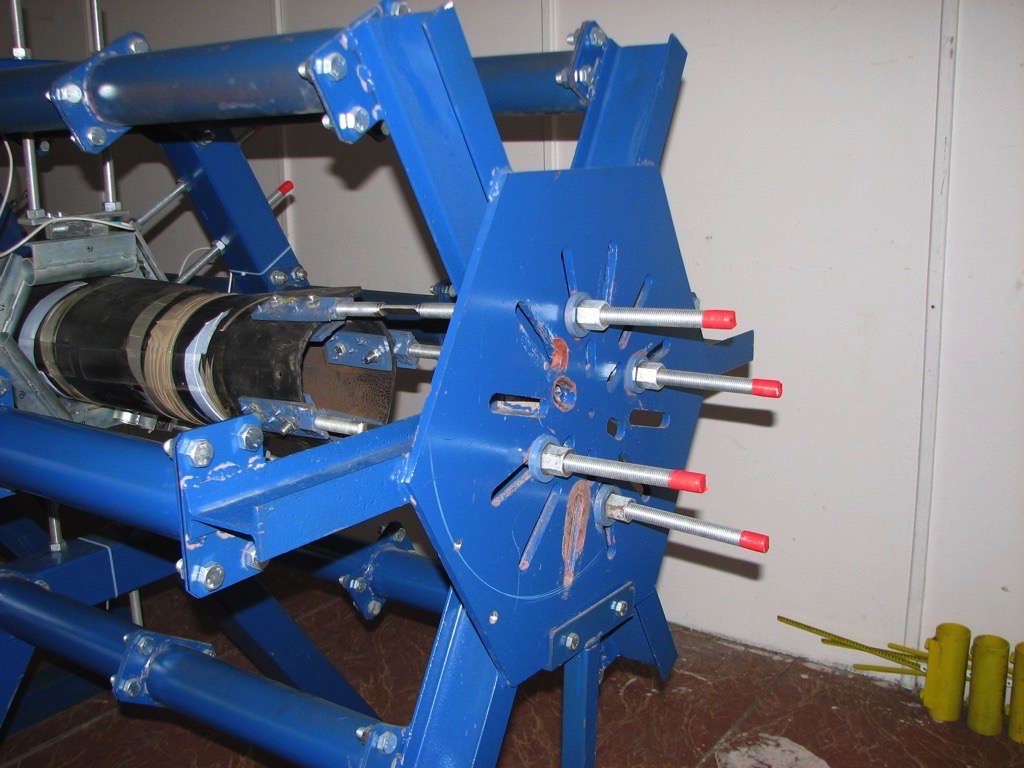
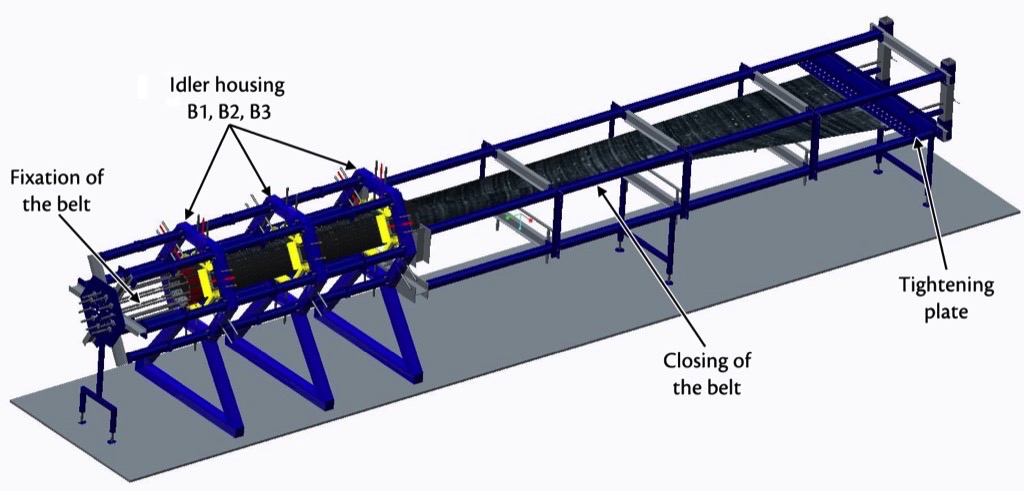
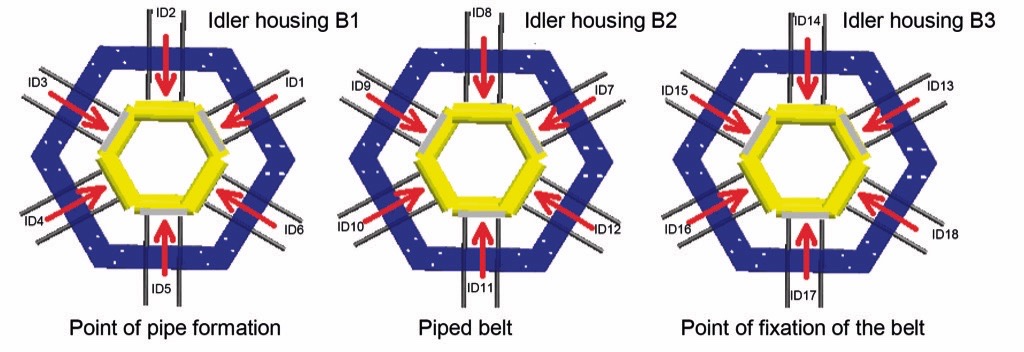
Measuring of the stress-deformation states was performed in order to identify the individual forces that are induced due to acting of the transport belt on the individual guiding idler rolls in three idler housings. Fig. 2 illustrates the measuring principle using the 8 m long specimen section of the pipe conveyor belt. Fig. 3 identifies the measuring points of the contact forces in the measurement places on the idler rolls of the test equipment in the hexagonal idler housings B1 to B3.
The main purpose of the measuring process was to analyse and to measure forces, which are created due to packing sequence of the rubber-textile transport belt into the piped shape. This procedure is occurring not only during the pipe conveyor operation, but also in the phase of installation or replacement of the transport belt. So, no influence of the transported material was applied during the measurement.
It is a well-known fact that determination of forces in the conveyor belt is a very difficult task also due to a fact that the belt is a hyper-elastic material with orthotropic behaviour. There are many papers in the literature dealing with this problem.This fact was relevant during selection of the points suitable for installation of the individual strain gauges. The measuring procedure was realised in several series in order to obtain the maximum amount of the measured data.
2. Measuring Process
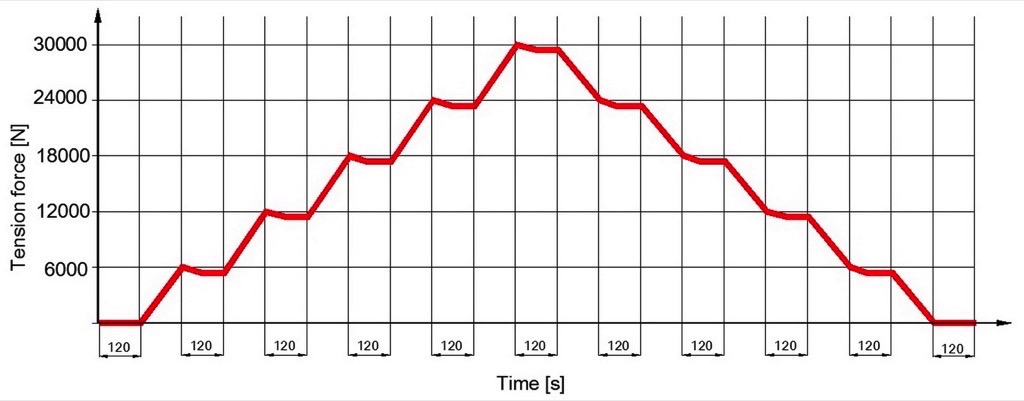
The measuring process was realised in such way that the tightening force was increased step by step by 6000 N each up to the maximum force level of 30 000 N. The relaxing time of the belt lasted 120 seconds at the determined force level.After achievement of the maximum level the tightening force was reduced stepwise to the initial value 0 N, again using steps of 6000 N.The measurements regarding the time behayiour were repeated 10 times, which is presented in Fig. 4. The data obtained from the individual measuring were recorded continuously by means of the Labwiev software using a sampling frequency of 10 Hz. In total, up to 24 000 values of the contact forces were recorded and processed from one measurement cycle.
3 .Results of the Measuring Process
Information about the stress-deformation relations in the conveyor belt is an important indicator, as these relations have a direct effect on the conveyors operational factors, just as they influence the lifetime and damages of the conveyor belt. By means of their identification we can obtain relevant information from the theoretical or experimental procedures.The average values of the contact forces were calculated for the individual idler rolls during tightening and relaxing process according to the base of measured values. There were identified the maximum values of the contact forces.
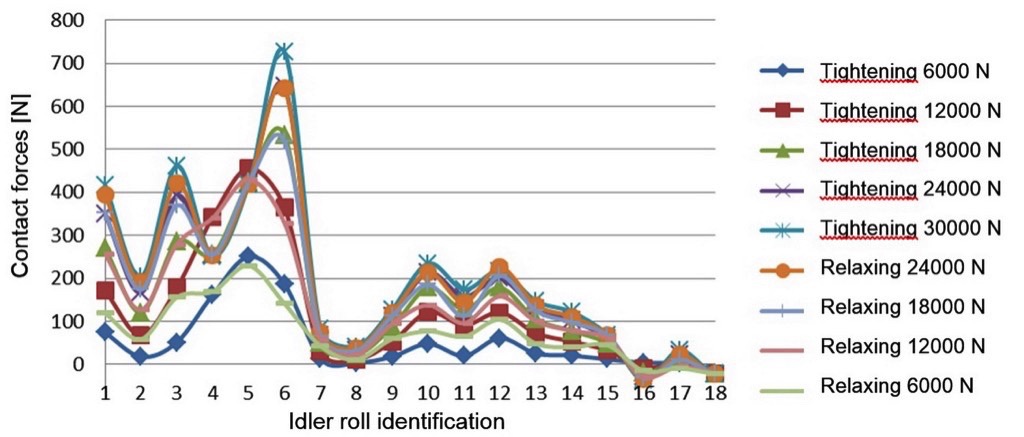
- Average contact forces in the individual idler rolls of the idler housings during tightening and relaxing of the transport belt (Fig. 5),
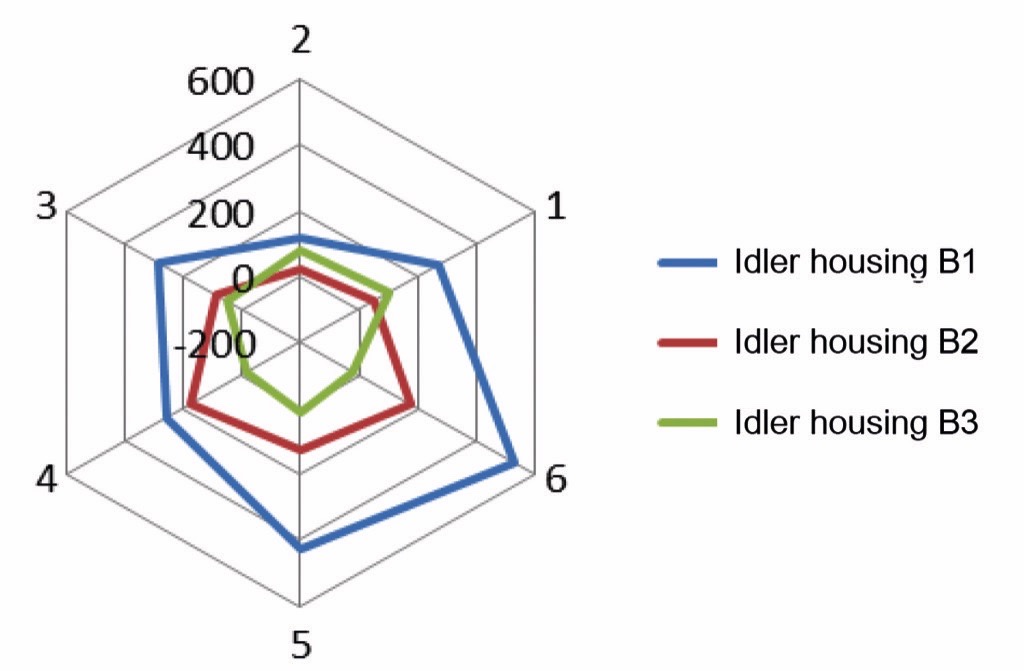
- Average contact forces in the idler rolls of the three idler housing during tightening of the transport belt (Fig. 6),
- Determination of the idler roll loadings by the average contact forces in the framework of three idler housings and in the framework of each idler housing (Table 1).
| Cell | ||||||
| Idler Housing | B1 | B2 | B3 | |||
| Mesurement No. | Most | Least | Most | Least | Most | Least |
| 1 | ID6 | ID2 | ID10 & ID11 | ID8 | ID13 | ID16 |
| 2 | ID5 | ID2 | ID10 | ID8 | ID13 | ID16 |
| 3 | ID5 | ID2 | ID10 | ID8 | ID13 | ID16 |
| 4 | ID6 | ID2 | ID10 | ID8 | ID13 | ID16 |
| 5 | ID6 | ID2 | ID10 | ID8 | ID13 | ID16 |
| 6 | ID5 | ID2 | ID10 | ID8 | ID13 | ID18 |
| 7 | ID6 | ID2 | ID10 | ID8 | ID13 | ID18 |
| 8 | ID5 | ID2 | ID12 | ID8 | ID13 | ID16 |
| 9 | ID6 & ID5 | ID2 | ID12 | ID8 | ID13 | ID16 & ID18 |
| 10 | ID6 | ID2 | ID12 | ID8 | ID13 | ID16 |
The least values of the contact forces were recorded in the overlapping area of the packed belt (idler roll ID2) and the highest increase of the contact force was observed in the bottom part of the belt (idler roll ID6). During almost all the performed measuring it was evident, which of the idler rolls was loaded maximally or minimally. The same loading of the idler rolls was monitored during measurement No. 9 in the case of the idler housings B1 and B3.There were elaborated and evaluated the following statistical values of the obtained measured data: minimum, maximum, numerical characteristics of position (arithmetic mean, median, modus), numerical characteristics of the variability (standard deviation, data dispersion), skewness and sharpness for the measured contact forces in the hexagonal idler housing (Table 2).
| Idler Roll | No. of Values | Min [N] | Max [N] | Max - Min [N] | Arithmetic Mean [N] | Data Dispersion | Standard Deviation | Skewness | Sharpness |
| ID1 | 100 | 71.91 | 76.41 | 4.50 | 74.14 | 0.84 | 0.73 | 0.10 | 1.95 |
| ID2 | 100 | 16.23 | 20.15 | 3.92 | 18.26 | 0.84 | 0.92 | 0.30 | -0.33 |
| ID3 | 100 | 50.00 | 53.69 | 3.69 | 51.71 | 0.56 | 0.75 | -0.26 | 0.33 |
| ID4 | 100 | 160.08 | 163.37 | 3.29 | 161.77 | 0.52 | 0.72 | 0.19 | -0.37 |
| ID5 | 100 | 246.04 | 253.56 | 7.51 | 250.45 | 1.85 | 1.36 | -0.88 | 2.17 |
| ID6 | 100 | 183.22 | 188.53 | 5.31 | 186.41 | 1.12 | 1.6 | -1.07 | 0.80 |
| ID7 | 100 | 11.46 | 15.86 | 4.40 | 13.53 | 0.58 | 0.76 | 0.15 | 1.26 |
| ID8 | 100 | 2.66 | 5.39 | 2.73 | 4.5 | 0.41 | 0.64 | 0.25 | -0.33 |
| ID9 | 100 | 16.80 | 21.27 | 4.47 | 18.54 | 0.47 | 0.69 | 0.48 | 3.25 |
| ID10 | 100 | 46.69 | 50.42 | 3.73 | 48.21 | 0.59 | 0.77 | 0.53 | -0.13 |
| ID11 | 100 | 18.68 | 22.30 | 3.62 | 20.46 | 0.55 | 0.74 | -0.07 | -0.32 |
| ID12 | 100 | 59.42 | 62.91 | 3.28 | 61.41 | 0.49 | 0.70 | -0.05 | -0.12 |
| ID13 | 100 | 22.29 | 27.97 | 5.68 | 25.78 | 1.4 | 1.2 | -0.76 | 2.73 |
| ID14 | 100 | 18.11 | 22.90 | 3.98 | 20.91 | 0.73 | 0.86 | -1.36 | 1.17 |
| ID15 | 100 | 10.30 | 14.54 | 4.24 | 12.22 | 0.74 | 0.86 | 0.35 | 0.76 |
| ID16 | 100 | 2.55 | 5.96 | 3.41 | 4.13 | 0.57 | 0.76 | 0.23 | -0.37 |
| ID17 | 100 | 0.50 | 4.61 | 4.11 | 2.44 | 0.56 | 0.75 | 0.20 | 1.55 |
| ID18 | 100 | -21.52 | -17.85 | 3.68 | -20.02 | 0.53 | 0.73 | 0.63 | -0.04 |
The arithmetic mean was evaluated during measuring of the stress-deformation relations in the transport belt because the measured values of the contact forces did not have the multi-peak distribution. Another reason for determination of the arithmetic mean was a fact that the individual distributions of the measured contact forces did not have open classes in the margins and the distribution was asymmetric.The next evaluated data, obtained from the measured values, is the standard deviation, which is a suitable factor for the testing statistics. The standard deviation is applied for a reliable estimation of the basic data file dispersion, which is defined as the mean square deviation in relation to the mean value.The next step was determination of the skewness, which describes symmetry of the monitored distribution of the contact force values around the mean value. The positive skewness was in the case of 11 idler rolls from the 18 investigated overall (ID1, ID2, ID4, ID7, ID8, ID9, ID10, ID15, ID16, ID17, ID18), what means that the most of the measured values are situated more left from the arithmetic mean. Seven idler rolls had the negative skewness (ID3, ID5, ID6, ID11, ID12, ID13, ID14), so these values were situated right from the mean value.The sharpness is a distribution characteristic of the contact forces values, which compares the given distribution with the normal probability distribution. Together 10 of the overall 18 idler rolls had the positive sharpness (ID1, ID3, ID5, ID6, ID7, ID9, ID13, ID14, ID15, ID17), what means that most of the contact force values are situated close to the mean value and the density curve is more sharp shaped than normal distribution curve. The other 8 idler rolls had the negative sharpness (ID2, ID4, ID8, ID10, ID11, ID12, ID16, ID18), thus the distribution is more uniform and its density curve is more flat in comparison to the normal distribution.
5. Concluding Remarks
It is possible to say, after statistical evaluation of the measured values that the existing relation among the tension forces and contact forces is not random in the case of the measuring realized at the idler housings B1 and B2. The fastening of the transport belt influenced the values obtained from the idler housing B3. This fact was confirmed also by the statistical evaluation. From this reason these values are not considered in the next research process.The following investigation will be oriented towards a verification of the results obtained from the experimental measurements using the computer-aided simulation. There will be determined mathematical models specified for determination of relations among the contact forces and tension forces at the forming idler rolls of the idler housings in dependence on the tension force value. Such relations offer important information for users and producers of the pipe conveyors in order to optimise their operational characteristics with regard to the motional resistances and selection of a suitable kind of the conveyor belt. Afterwards it will be possible to apply the mathematical models by means of an indirect measuring method.
Acknowledgement
This work is a part of these projects VEGA 1/0922/12 Research of effect of material characteristics and technological parameters of conveyor belts on size of contact forces and resistance to motion in pipe conveyors with experimental and simulation methods, VEGA 1/0258/14 Study of input parameter relations for interoperable transport effectivity based on mathematical model application.
A Note from the Editor
For all statements in this article that refer – directly or indirectly – to the time of publication (for example “new”, “now”, “present”, but also expressions such as “patent pending”), please keep in mind that this article was originally published in 2014.
References:
- P. Bigos, J. Kulka, K. Kubin, M. Mantic, and M. Kopas: Professional verification of crane track beams in heavy metallurgical operation by means of tensometry. in Experimental stress analysis, 2009, pp. 30-37.
- K. Madac, V. Durkac, and J. Kral: Design of applications for CAD system Creo Parametric 1.0. Int. Sci. Her., vol. 4, no. 23, pp. 278-284, 2012.
- P. Bozek and E. Pivarciova: Registration of Holographic Images based on integral Transformation. Comput. Informatics, vol. 31, no. 6, SI, pp. 1369-1383, 2012.
- S. Hotte, L. Overmeyer and T. Wennekamp: Research on the Form Force Behaviour of a Pipe Conveyor in Different Curve Radii. Bulk Solids Handl., 2011.
- P. Michalik, V. Molnár, G. Fedorko, and M. Weiszer: An Experimental Test Rig for Measuring the Strength of Pipe Conveyor Belts. Bulk Solids Handl., vol. 33, no. 5, pp. 52-55, 2013.
- P. Michalik and J. Zajac: Using of computer integrated system for static tests of pipe conveyer belts. in Proceedings of the 2012 13th International Carpathian Control Conference, ICCC 2012, 2012, pp. 480-484.
| About the Authors | |
 Prof. Gabriel FedorkoProfessor Gabriel Fedorko works at the Logistics Institute of industry and transport, Faculty BERG, Technical University of Kosice as Head of Logistics Institute of Industry and Transport. Within his scientific research activities he devotes himself to modeling and simulation of ecological transport systems. Prof. Gabriel FedorkoProfessor Gabriel Fedorko works at the Logistics Institute of industry and transport, Faculty BERG, Technical University of Kosice as Head of Logistics Institute of Industry and Transport. Within his scientific research activities he devotes himself to modeling and simulation of ecological transport systems. |
|
 Assoc. Prof Vieroslav MolnárAssoc. Professor Vieroslav Molnár works at the Logistics Institute of industry and transport, Faculty BERG, Technical University of Kosice as Head of Division of Transport. His research interests include the steel ropes and pipe conveyors simulated by CAD systems Catia and Creo. Assoc. Prof Vieroslav MolnárAssoc. Professor Vieroslav Molnár works at the Logistics Institute of industry and transport, Faculty BERG, Technical University of Kosice as Head of Division of Transport. His research interests include the steel ropes and pipe conveyors simulated by CAD systems Catia and Creo. |
■