
In general the qualitative analyses revealed that the maximum loads on the individual rolls for the belt with the overlap on the top were in the range of 40% of the sum of absolute values of all the six contact forces. For the overlap on the bottom, the forces were in the range of 80%. The idler load diagrams, obtained with the various test rig configurations and belt types, deviated substantially, making their comparison between each other rather problematic. However, the test results, obtained with the some test rigs, showed similarities in the load patterns. The paper emphasises the need in development a uniform standard regarding pipe conveyor test rig configurations and the supplementary test procedure.
Introduction
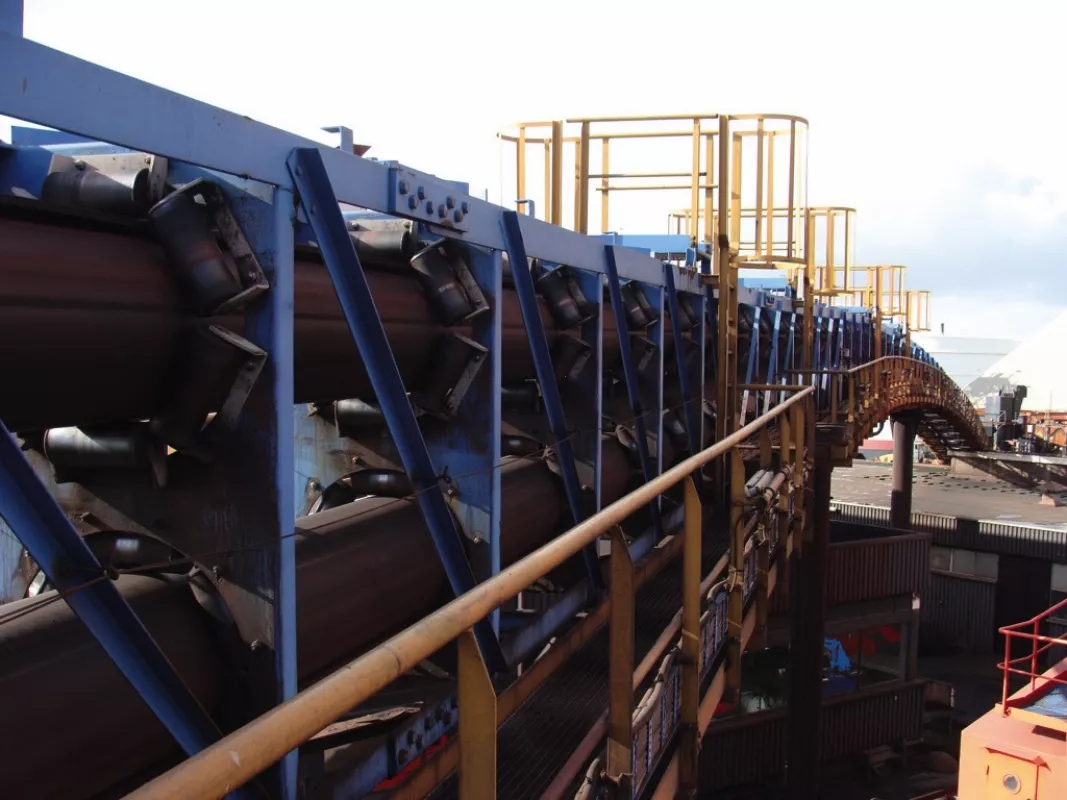
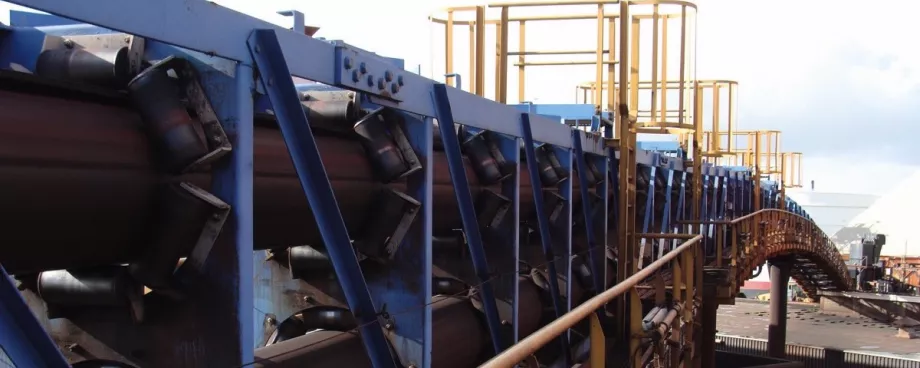
Pipe belt conveyors have been recognized as effective enclosed continuous transport systems. They are well-known due to their ability to negotiate tight route curves and steep inclinations [1-3]. Another important benefit of their design is that the conveyed bulk material is well-protected from the impact of the environment and vice versa. Pipe belt conveyors are used for transporting various dry bulk and powder materials, like cement, limestone, coal, iron ore, biomass etc. They are widely applied in the cement industry, construction industry, mining, marine ports, power stations and industrial plants.
The main challenge for the industry using pipe conveyors is the complete lack of uniform standards, which can assist in the pipe conveyor design and belting, and can guarantee reliable operation of the system in the field. It is necessary to develop standards that provide recommendations on the relation between the major belt parameters, like pipe diameter, overlap percentage in respect to the belt width, and minimum belt transverse stiffness. Most of the time, the empirical practical experience in combination with the standards developed for conventional trough belt conveyors are applied. The independent and confidential know-how of companies active in the pipe conveyor design and belting, that is inherent to a normal competitive business, results in a deviation in offered products and their properties. The absence of any pipe conveyor related standards in the industry allows for the possibility of the appearance of products with low or questionable quality in the market.
In order to check the quality of pipe conveyor belting, the properties of manufactured belts need to be determined experimentally. For this purpose various pipe conveyor test rigs have been built. The prime objective of many test rigs is the measurement of the contact forces between the belt and the idler rolls. These contact forces are important for the performance of the pipe belt. If the contact forces are too low or there are contact losses between the belt and idler rolls then the belt is not stiff enough and might not be able to keep its pipe shape. If the contact forces are too high then the belt is too stiff and might draw too much power while in operation. Depending on the test rig configuration, also belt deflection and its tendency to buckle and twist at curves can be measured.
Since there is no uniform standard on the lay-out of pipe conveyor test rigs and the accompanying test procedure, differences in the design of test rigs may affect the experiment results and eventually lead to wrong conclusions on the performance and reliability of the tested product. The main purpose of the present paper is to give an overview of the existent pipe conveyor test rigs and to provide an analysis of the measured contact forces in relation to the test rig configuration. This paper is divided into 3 parts: Part A is devoted to the static six-point testing devices; Part B elucidates existent static test rigs with various frames and supports; Part C primary is focused on the dynamic measurements. Present paper introduces Part A.
1. Contact Forces and Test Rig Configuration
The test rig design determines the costs required for its manufacturing and installation. As can be seen in the following chapters, some test rigs can be quite massive and voluminous and, as a result, relatively expensive. An incorrect design can dramatically affect the test results and lead to the futility of the investment. That is why it is important to analyse the existent test rig designs, discuss their advantages and disadvantages and to compare test results, obtained with the different rig configurations.
Due to the unavailability of detailed information on testing pipe conveyor belts and the limited number of existing test rigs, the results, selected for this paper, are used only for a qualitative analysis. The test results are sensitive to errors, like an improper choice and calibration of sensors, incorrect data acquisition and processing, and human factor. Therefore, the accuracy and statistical significance of test results, obtained with various test rigs as published in different sources cannot be guaranteed.
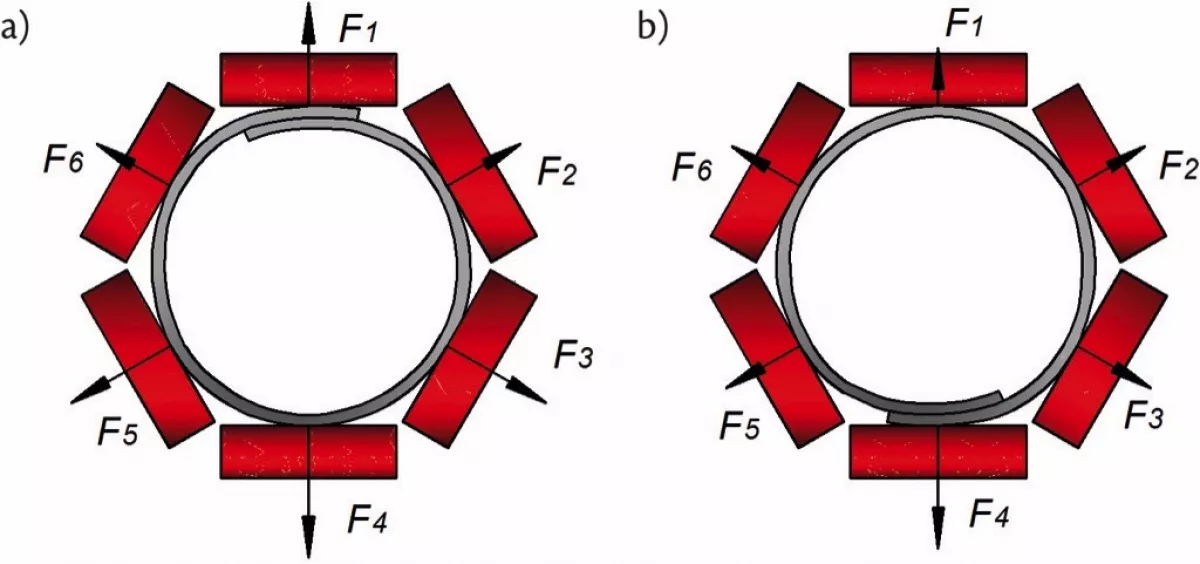
For the comparison of contact forces obtained with the different test rigs, the results were selected that represent conveyor operation without bulk material, with the overlap on the top (Fig. 2a) and at the bottom (Fig. 2b). The bottom overlap position commonly implies the return strand of pipe conveyors. Each of the presented contact forces is given as its percentile ratio to the absolute values of all six contact forces for each test case (Fn/Σ|Fn|). The rate of overlap of the pipe belt is presented as a ratio of the belt width to the pipe diameter (B/D). For simplification the understanding of the data from different sources, the contact forces were adjusted to the belt position, forming clockwise coil, and numerated, as illustrated in Fig. 2. Since the belt design plays a decisive role in the pipe conveyor performance, the results were supplemented with the information on the belt properties, whatsoever was provided in a source.
![Fig. 3: Six plate wooden test set-up at Delft University of Technology, Section of Transport Engineering and Logistics, the Netherlands [4]. (Picture: © Delft Univ. Technol.)](https://www.bulk-online.com/sites/default/files/public/styles/basic_max/public/2023-12/wp_1049.jpg.webp)
In general the existing test rig configurations can be classified based on their ability to perform static and/or dynamic tests. The dynamic tests also include pipe conveyor field measurements. The current overview was structured based on this classification, organizing test rig designs according to the principle from simple to complex. Present Part A is devoted to the static pipe conveyor test rig designs, particularly the six point stiffness testing devices.
2. Static Test Rig Design: Six-point Stiffness Testing Device
The test rig, described in [4], was assembled at the laboratory of Delft University of Technology, Section of Transport Engineering and Logistics. It consists of a wooden supporting frame with 6 plates, situated hexagonally (see Fig. 3). Twelve sensors were mounted in between the frame and the plates, wherein 2 sensors were used for each plate. For the measurements three samples of the same pipe conveyor steel cord belt were used with an approximate length of 150 mm. The belt properties and ratio between belt width and pipe diameter are shown in Table 1.
| Sample N° | Belt type | Belt width [mm] | B/D [-] |
|---|---|---|---|
| 1 | St 3500 | ≈ 1800 | ≈ 4 |
| 2 | |||
| 3 | |||
| Sample N° | Troughability | Overlap position (see Fig. 2) | Tension |
| 1 | 0,334 | Top | no |
| 2 | 0.341 | ||
| 3 | 0.341 |
The sensors measured the load in radial direction for approximate 10 seconds with sample rate of 5 Hz for each case. The average sum of the results, obtained from both sensors, represented the contact force acting on the corresponding plate. The experiment was performed 2 times for each sample (Test 1 and Test 2). The test results are presented in Fig. 4.
![Fig. 4: Contact forces Fn/Σ|Fn| (%), obtained from the test set-up at Delft University of Technology, Section of Transport Engineering and Logistics [4], measured 2 times (Test 1 and Test 2) for each of the samples: a) 1, b) 2 and c) 3. The results are adjusted according to the reference Fig. 2a. (Picture: © M.E. Zamiralova, Delft Univ. Technol.)](https://www.bulk-online.com/sites/default/files/public/styles/basic_max/public/2023-12/wp_1048.jpg.webp)
Analysis of the data shows that the results for the same belt type, same rate of overlap and belt width can differ significantly between tests. This can be explained from the fact that the friction between the external surface of the belt and wooden hexagon plates was not controlled during the tests. The sensors measured only loads in radial direction, consequently the force components from the friction that can be significant, were not detected by the measuring equipment. Moreover, the friction between the belt edges was not eliminated as well, and the belt tended to “stick” on itself at the overlap. As a result, the measurement data was very sensitive to the way the belt samples were placed in the test rig.
A positive side of this test rig configuration is that it is light, compact and cheap. The experiment is easy to perform and requires belt samples with short length, which makes it possible to use the same samples as used for the troughability test. The assembly of two sensors per plate provided additional information about which side of the supporting plate had a greater load, reflecting the load distribution along the belt coil. Moreover, the impact of friction on the test results could be reduced by means of the special material sheets with low friction coefficient that can be inserted between the belt and the plates and also the overlapping edges of the belt. The relaxation effect due to the viscoelastic properties of the belt rubber compounds originally was not considered in the results. However, this can be corrected by extending the experiment time performance for each of the case.
The main disadvantage of the test rig design is that it was designed specifically for the width of the samples, which were available in the laboratory. This implies that the construction could not be adjusted for different belt widths, rate of overlap and length of the supporting hexagon plates.
![Fig. 5: Six-point pipe belt stiffness testing device, elaborated by Conveyor Dynamics Inc. together with Goodyear Engineered Products, Veyance Technologies Inc. [5,7]. (Picture: © Conveyor Dynamics Inc., Veyance Technol., Inc.)](https://www.bulk-online.com/sites/default/files/public/styles/basic_max/public/2023-12/wp_1047.jpg.webp)
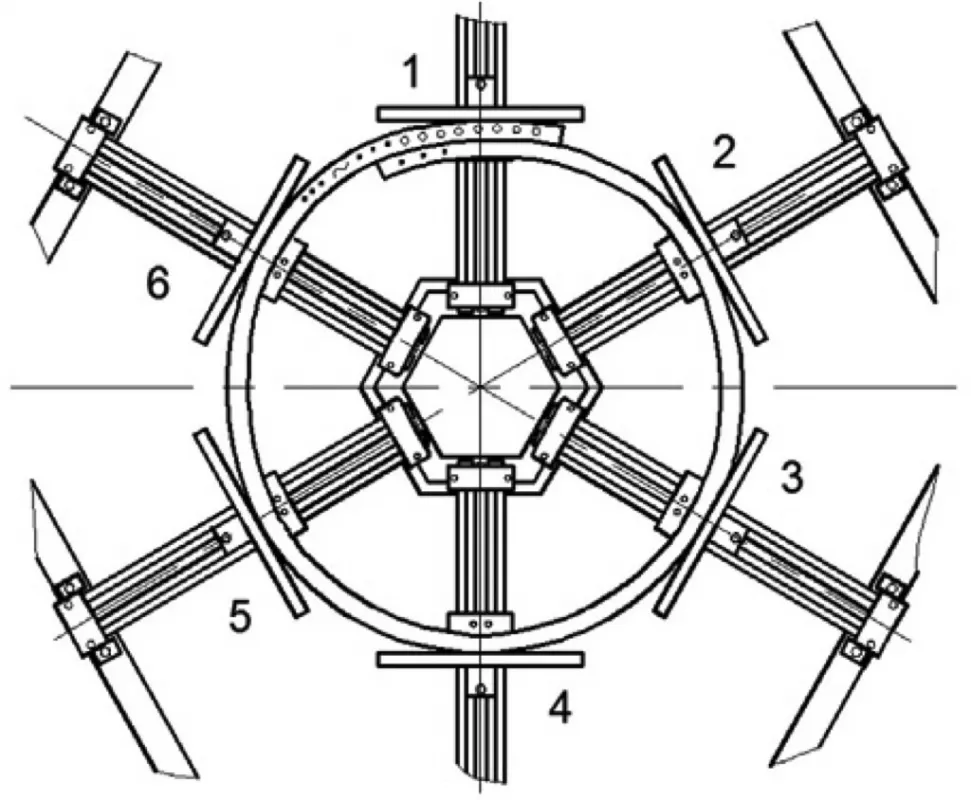
![Fig. 6: Six-point pipe belt stiffness testing device of the Taiyuan University of Science and Technology [6]. (Picture: © s. Xiaoxia, Taiyuan Univ. Technol.)](https://www.bulk-online.com/sites/default/files/public/styles/basic_max/public/2023-12/wp_1046.jpg.webp)
Based on the same design concept, other pipe conveyor 6 point testing devices are known, which are equipped with a mechanism for forming different pipe diameters for the various belt widths and required rate of the overlap. One of the test rig elaborated by Conveyor Dynamics Inc. together with Goodyear Engineered Products, Veyance Technologies Inc., was mentioned by Zhang andSteven [5] (see Fig. 5).
Similar test rig configuration was introduced by Xiaoxia et al. [6], Taiyuan University of Science and Technology, China and illustrated in Fig. 6.
The presented six-point test devices also can perform experiments with belt samples with length, similar as it is required for the troughability test. However, for the particular test rig configurations there are no quantitative test results available in the mentioned sources [5,6]. The design of these test rigs implies six contact points, eliminating the length variation of the supporting plates, which can influence the load distribution between the hexagon supports.
Delft University of Technology, Section of Transport Engineering and Logistics studied the influence of the different rate of the overlap and different belt types on the contact forces of a pipe belt conveyor. For this purpose similar experiments were performed with a six-point stiffness test rig developed and owned by Phoenix Conveyor Belt Systems GmbH. An approximate sketch of the test rig design is presented in Fig. 7.
The test rig contained a hexagon frame with six sensors, connected to the plates, which could be easily dismounted and replaced by the plates with different lengths. In order to form the required pipe diameter, the plates with the sensors could move in radial direction by adjusting the special screw slide-ways.
In order to eliminate the impact of the friction forces, sheets of foil paper with low friction properties were placed between the belt edges in the overlap and also between the belt’s external surface and the supporting plates. For the monitoring of the experiment accuracy and eliminating impact from the friction forces, the automatically determined total vertical load-vector, from all the sensors, had to yield the total belt weight, and the total horizontal force-vector, defined by the friction forces, should be close to zero.

