Power consumption is the major parameter of analysis of any pneumatic conveying system. In this paper different parameters affecting power consumption are studied. These important parameters are considered to find a correlation with non-dimensional power. The correlation is found to be in good agreement with experimental data. From the experimental data the optimal value of specific power consumption and non-dimensional power are calculated.
Also fluidized dense phase conveying through long distances is quite complex due to change of flow mode during the process of conveying at some location along the pipeline. It is quite difficult to locate the exact location of transition of flow mode from dense to dilute. For the purpose of analysis, pressure data of three 2 metre sections of pipeline at different locations along pipeline are considered. So in this paper the variations of a non-dimensional power or power consumption coefficient and transient parameter pulse amplitude at three different locations along the length of pipeline are analysed.
1 Introduction
Pneumatic conveying of certain bulk materials has found its place in almost all kinds of industries such as chemical, pharmaceutical, mining and manufacturing due to its certain advantages over other modes of conveying. Pneumatic conveying can be classified into two types based on the mode of flow: dilute phase conveying and dense phase conveying. over two decades dense phase conveying has become a popular method of conveying as compared to dilute phase due to certain advantages such as low power consumption, low erosive wear and low attrition of particles. at low superficial gas velocities, fine particles having high aeration capability tend to be conveyed in fluidised dense phase conveying with upper dilute mode of flow and lower dense mode of flow [1].
The process of fluidised dense phase conveying of fine particles through long distance conveying is mostly applied in industries. This type of conveying is quite complex due to change of flow mode during the process of conveying at some location along the pipeline. Although power consumption is the major parameter of analysis of any pneumatic conveying system, so far few researches have been carried out on study of power consumption in fluidised dense phase conveying through long distances. Ramakrishnan and Rao [2] developed a correlation for specific power consumption by conducting pneumatic conveying tests of cement, fly ash, raw meal and pulverized coal through a 40 metre conveying pipeline. Since conveying gas velocity is important parameter affecting power consumption, it is necessary to know about minimum transport boundary of gas velocity for particular conveying material. Mallick and Wypych [3] conducted experiments to find minimum inlet Froude number representing minimum transport boundary of conveying for different conveying materials.
Present study aims at studying different parameters affecting power consumption based on pneumatic conveying tests conducted using fly ash and alumina as conveying material at different solids loading ratios for dense mode as well as dilute mode of flow. These important parameters are taken into consideration for developing a correlation for non-dimensional power, which would be helpful in comparing with optimum values of non-dimensional power for particular conveying material as well as in assessing the effectiveness of each conveying test conducted.
Dense phase conveying of fine particles is highly pulsatile with upper layer of bed material is more likely to be expanded as compared to bottom layer. Due to pulse growth material bed expands which causes flow of material from the base. This causes the static pressure to fluctuate with respect to time. These pressure fluctuations are characterised by pulse amplitude, pulse frequency, etc. [4, 5]. In this paper variations of magnitudes of steady state parameter such as non-dimensional power and transient parameter such as pulse amplitude are analysed for different sections along the length of pipeline to find approximate location of transition of mode of flow from dense to dilute.
2 Experiment Set-up
A pneumatic conveying system pipeline of 173 metres length and 53 millimetre diameter was used for conducting the experiments. Figs. 2 and 3 show the schematic diagrams of the pneumatic conveying setup with a 1 cubic metre top discharge blow tank.
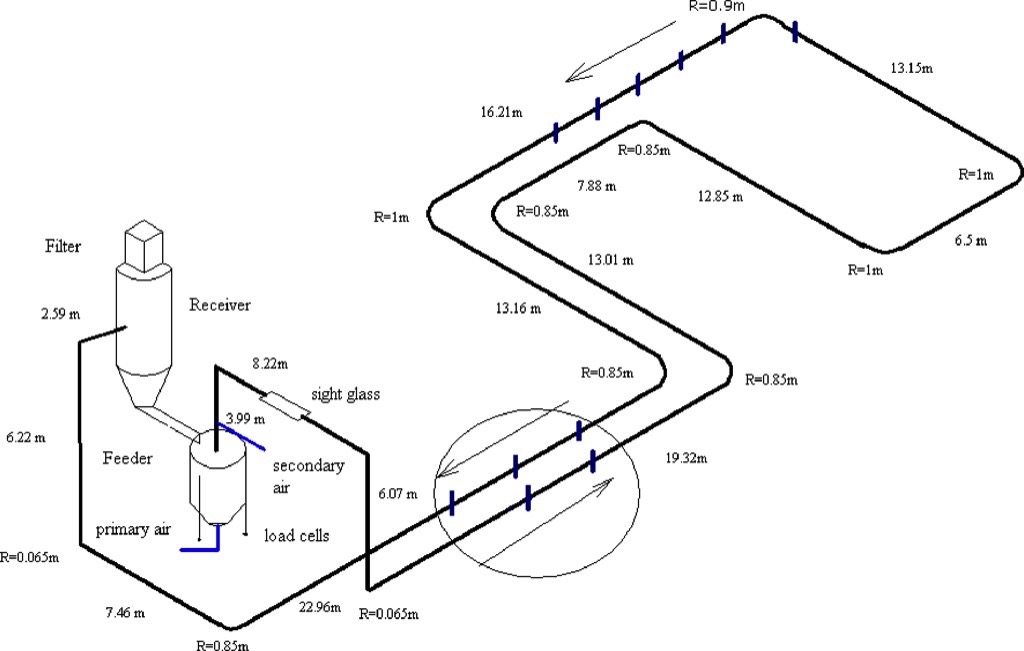
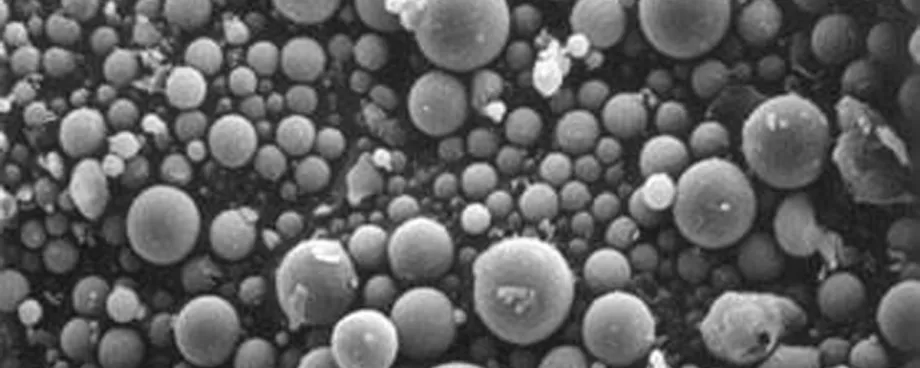
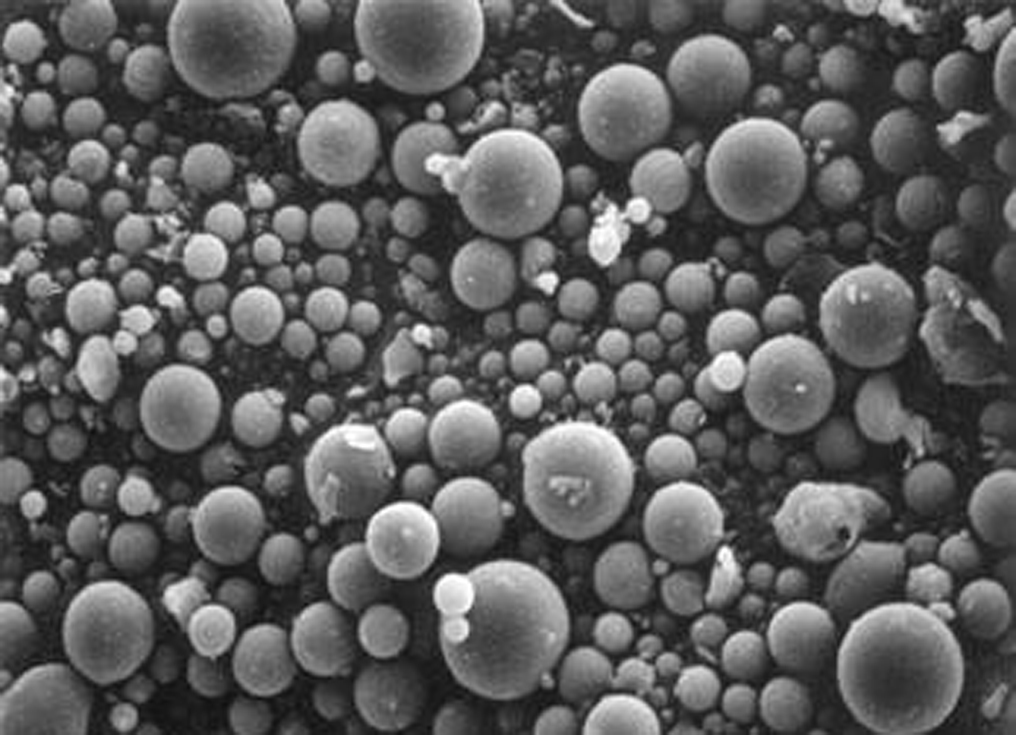
Several pressure transducers were placed on top and bottom of pipeline at different locations (about 27, 90 and 130 metres) along the length of pipeline. Fly ash and alumina were used for the conveying test (Table 1).
| Conveying Material | Mean Particle diameter dp [µm] | Particle density ρp [kg/m3] | Losse-poured bulk density ρbl [kg/m3] |
| Fly ash | 14.91 | 2096 | 724 |
| Alumina | 37.11 | 3810 | 988 |
Two separate transducers were used to measure primary air pressure and secondary air pressure. Solids mass flow rate from blow tank and into receiver were measured using load cells. Conveying tests for materials fly ash and alumina were conducted for a wide range of solids loading ratios. Conveying material was pre-pressurized to a certain pressure in a blow tank with the air mass flow rate controlled by a bank of sonic nozzles before feeding into the pipeline.
3 Effects on Specific Power Consumption
The specific power consumption is influenced, among others, by the inlet Froude Number, the inlet air kinetic energy, as well as the air mass flow rate.
3.1 Inlet Froude Number
The Froude number for a given powder material is defined as inertia forces (or driving forces) needed for a certain gravitational force. It is the ratio of inertia force to gravitational force. The inlet gas Froude number (Fri) can be expressed as:
![]()
where:
| Fri | = | Inlet Froude number | [-] |
| vai | = | Inlet air velocity | [m/s] |
| g | = | Gravity acceleration | [m/s2] |
| D | = | Pipe diameter | [m] |
The specific power consumption is defined as power consumed per kilogram of material conveyed. It can be calculated by using the following expression:
where:
| Pspec | = | Specific power consumption | [kW/(kg/s)] |
| ms | = | Solids mass flow rate | [kg/s] |
| V0 | = | Volumetric flow rate of free air | [m3/s] |
| pin | = | Pressure at inlet of pipeline | [Pa] |
| pout | = | Pressure at outlet of pipeline | [Pa] |
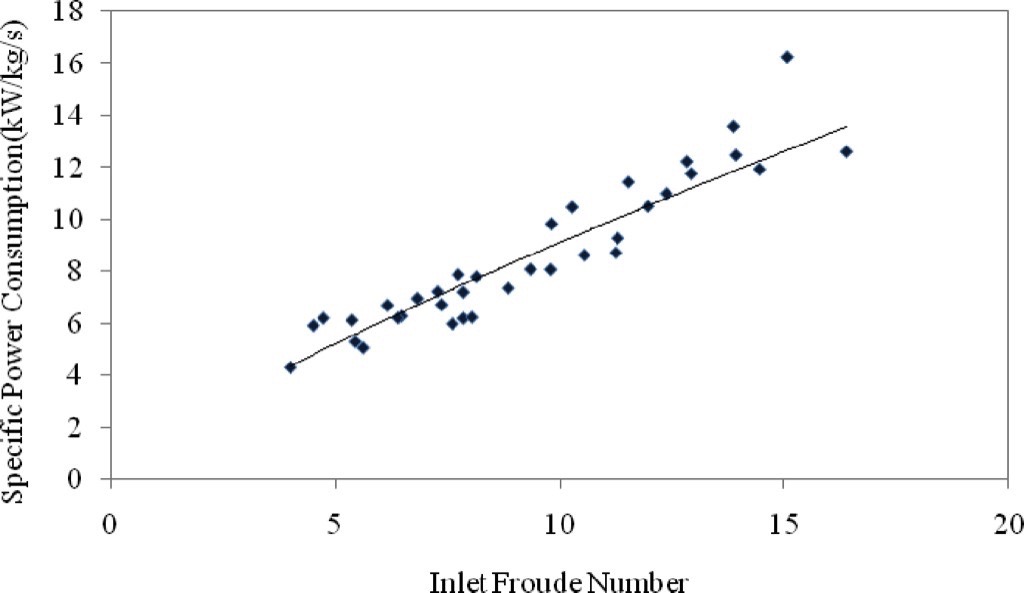
Fig. 4 shows that specific power consumption increases with increase in inlet Froude number for fly ash as conveying material. This indicates that specific power consumption reduces when conveying occurs at a higher solids mass flow rate while needing a minimum amount of inertia force or driving force. So there exists an optimum value of specific power consumption at a minimum inlet Froude number for each conveying material.
3.2 Inlet Air Kinetic Energy
The inlet air kinetic energy per unit volume (Ei) can be expressed as:
![]()
where:
| Ei | = | Inlet air kinetic energy per unit volume | [J/m3] |
| ρai | = | Inlet air density | [kg/m3] |
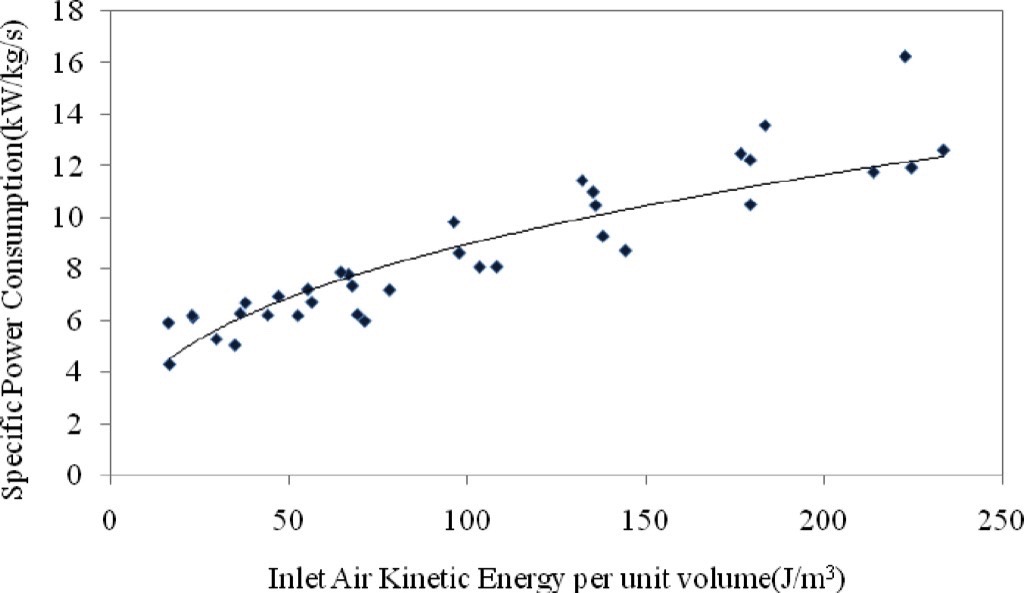
The effective utilisation of energy while conveying can also be analysed from the plot between specific power consumption and inlet air kinetic energy per unit volume shown in Fig. 5. Minimum specific power consumption occurs when inlet air requires a minimum amount of kinetic energy for the beginning of conveying process.
3.3 Air Mass Flow Rate
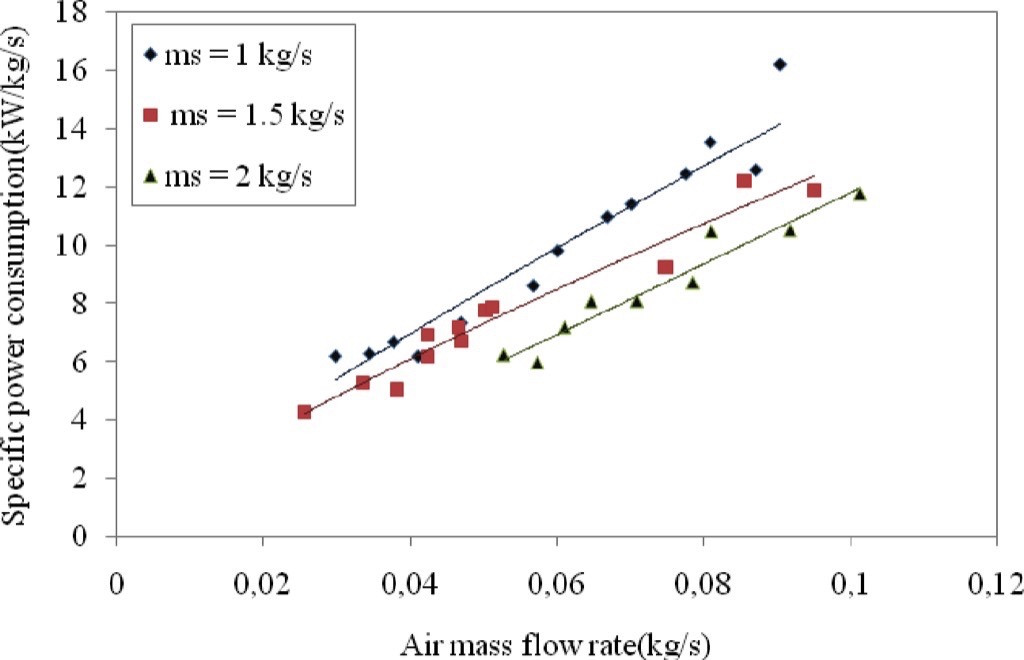
From Fig. 6 it is observed that specific power consumption increases with air mass flow rate at constant solids mass flow rates. This plot also shows that high specific power consumption occurs for conveying with low solids loading ratios. The minimum or optimum point of conveying occurs for the conveying using low air mass flow rate, high solids loading ratio and low specific power consumption.
| Conveying Material | Mean Particle diameter dp [µm] | Particle density ρp [kg/m3] | Losse-poured bulk density ρbl [kg/m3] |
| Fly ash | 19 | 2530 | 810 |
| Alumina | 79 | 3300 | 1050 |
| Cement | 11 | 3000 | 930 |
3.4 Power Consumption Coefficient
The most important parameters influencing the performance of a pneumatic conveying system are solids mass flow rate, air mass flow rate and total pressure drop. These three factors can be taken into consideration for developing a non-dimensional parameter, the power consumption coefficient (η). The minimum value of power consumption coefficient indicates the requirement of a lower total pressure drop for a higher solids mass flow rate.
The power consumption coefficient is calculated by:
![]()
where:
| η | = | Power consumption coefficient | [-] |
| ΔP | = | Total pressure drop | [N/m2] |
| Vai | = | Inlet volumetric air flow rate | [m3/s] |
| L | = | Total length of pipeline | [m] |
| Φ | = | Solids loading ration | [-] |
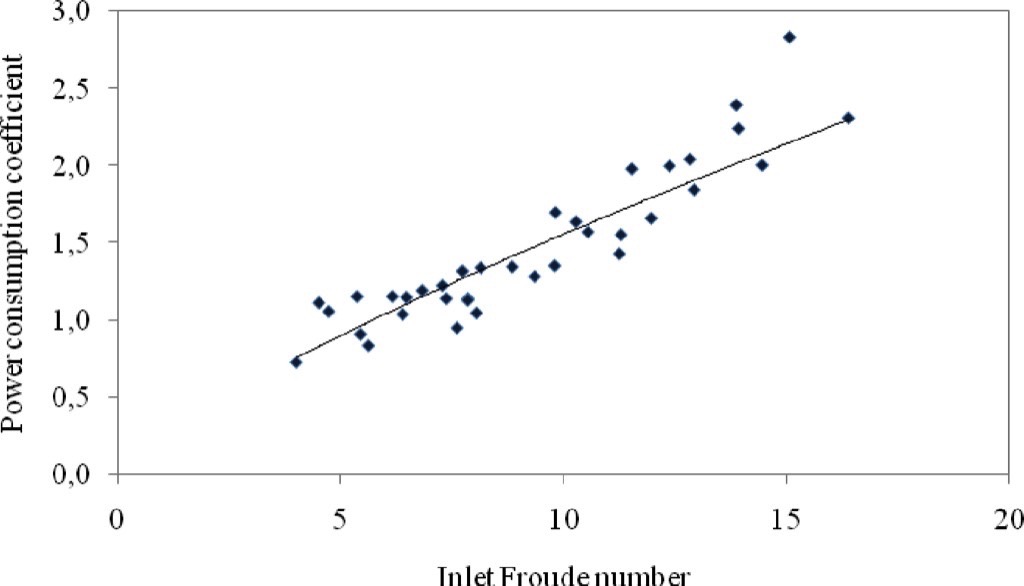
Similar to the specific power consumption, the power consumption coefficient for fly ash increases with increase in inlet Froude number as shown in Fig. 7. The minimum or optimum point of power consumption coefficient occurs where required driving or inertia force for conveying is least with high solids flow rate.
4 Correlation for Non-dimensional Power
From the above analysis it is observed that the non-dimensional power or power consumption coefficient (η) is highly influenced by non-dimensional flow parameters such as inlet Froude number (Fri) and solids loading ratio (φ). So it is essential to determine a relationship among η, Fri and φ. From this relationship, the predicted power consumption coefficient can be calculated. This predicted value can be compared with that of optimum power consumption coefficient for particular conveying material to make a judgment of the conveying process for a particular data set. So the expression for η can be written as following equation:
![]()
A set of simultaneous equations are constructed using the experimental data and these equations are used to form a regression matrix. Number of equations used is equal to the number of experimental data used. The unknown coefficient C and exponents (a and b) are computed by solving these equations. The correlation for non-dimensional power is given by:
![]()
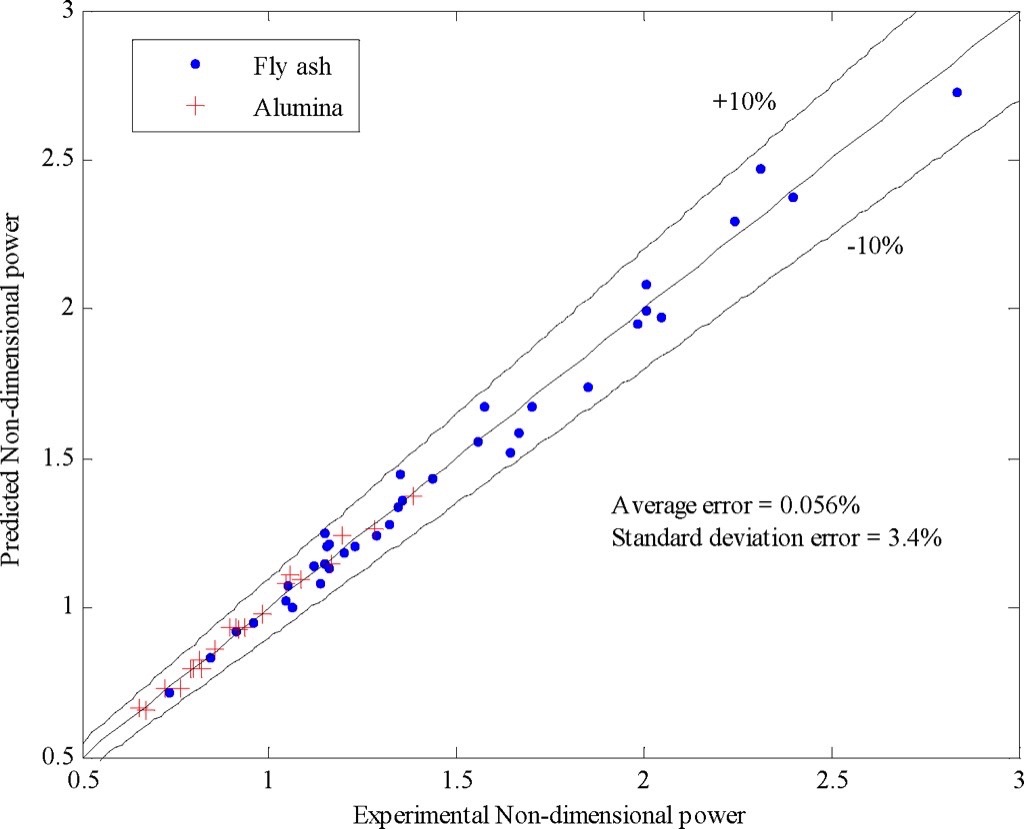
The predicted values of non-dimensional power are plotted against experimental values for all data of fly ash and alumina conveying material as shown in Fig. 8. These plotted data are lying within ± 10 per cent confidence limits. Fig. 8 also shows that calculated average error is 0.056 per cent with standard deviation of 3.4 per cent.
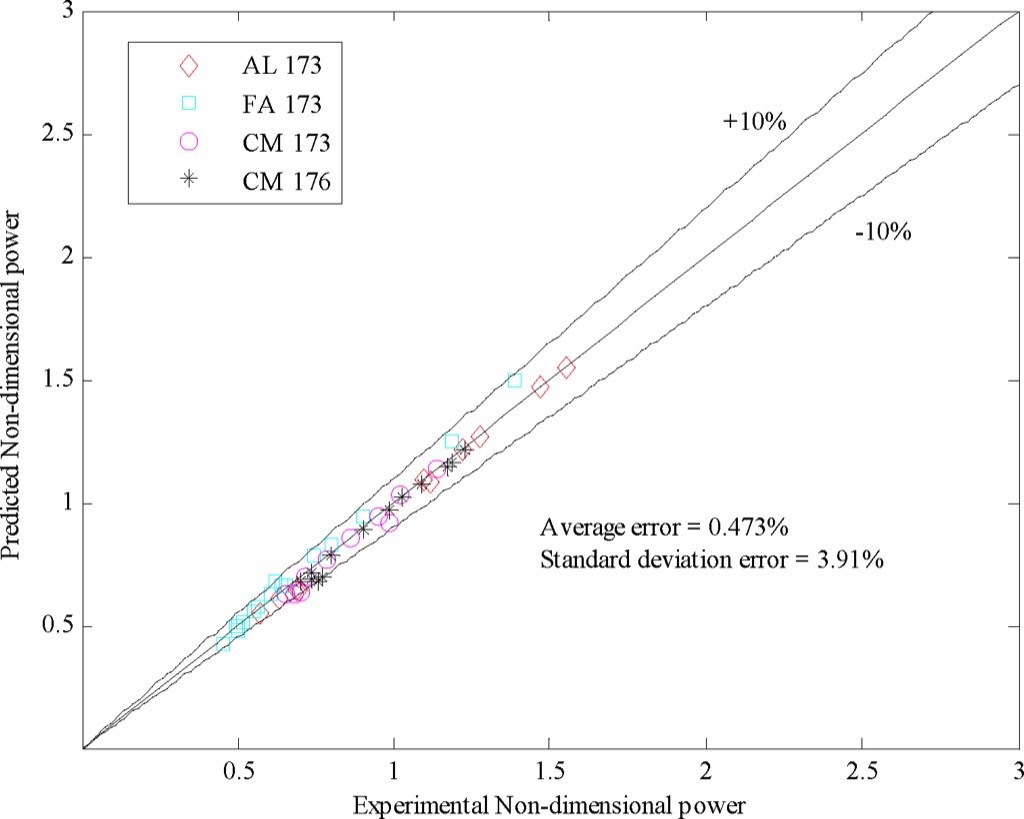
Above correlation for non-dimensional power is to be compared with other experimental data. Fig. 9 shows a comparison of predicted non-dimensional power calculated using above correlation and calculated non-dimensional power using experimental data from [4]. The calculated average error percentage is 0.473 per cent with standard deviation of 3.91 per cent.
5 Consumption Coefficient Variation
It is observed that the local pressure varies exponentially along the length of pipeline. In the above analysis the power consumption coefficient (η) is calculated for the whole length of pipeline. But the local value of the power consumption coefficient for a section of pipeline may be varying along the length of pipeline depending upon the location of pipeline section.
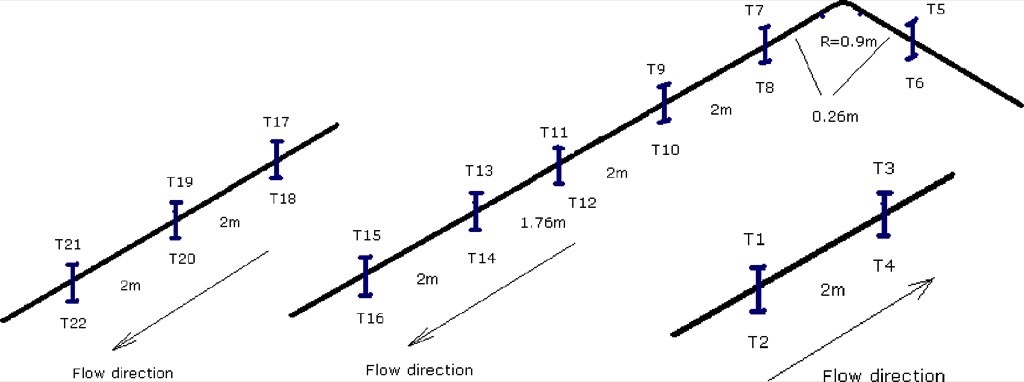
For the analysis presented in this article, three sections of pipeline of 2 metres length each at three different locations (27.26, 94.66 and 129.11 metres) along the length of conveyor pipeline are considered.
Fig. 10 shows the power consumption coefficient variation and Fig. 11 shows the pulse amplitude variation along the length of pipeline.
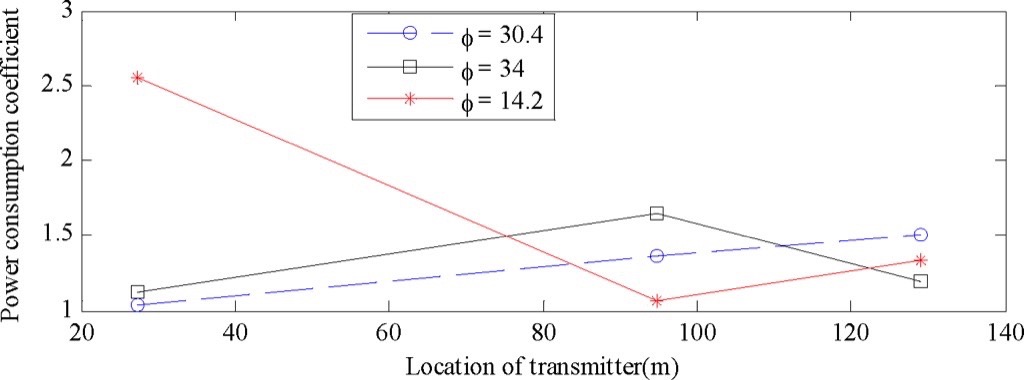
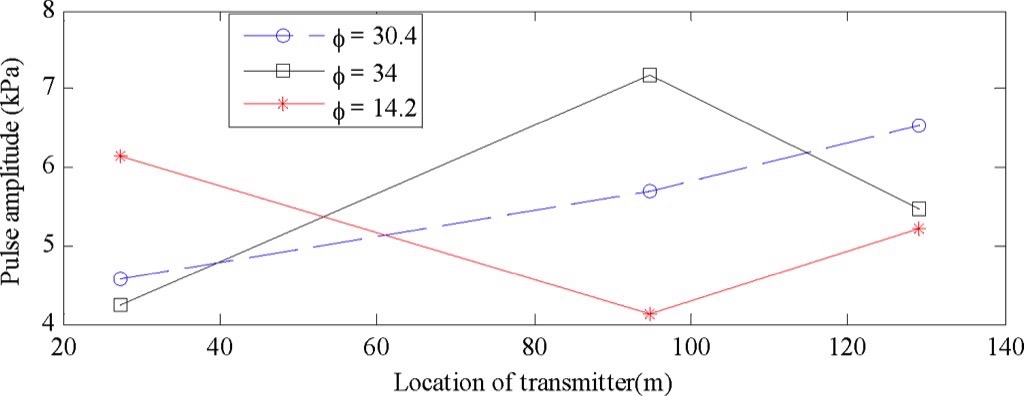
For dense phase conveying (φ = 30.4) for fly ash, the η value increases along the length of pipeline and gas pulse amplitude also increases along the length of pipeline. This suggests that there is gradual aeration of bed material while flow proceeds along the pipeline, for which the power consumption increases at different sections along the length of pipeline.
But in case of dense phase conveying with φ = 34 for fly ash, the η value as well as pulse amplitude increase up to certain distance and then decreases. Also superficial gas velocity at distances 94.66 and 129.11 metres are 10.5 and 14 metres per second respectively. This suggests that aeration rate increases as long as flow is in dense mode, but once flow becomes dilute the aeration rate decreases.
On the other hand for the flow started with dilute mode (φ = 14.2) for fly ash, both η as well as gas pulse amplitude value decrease gradually up to certain distance and then increase. Beyond this location flow consumes more power to convey materials due to which η value increases. Hence there is correlation between steady state parameter and transient parameter.
6 Optimum Consumption Coefficient
The optimum or minimum value of power consumption coefficient and specific power consumption varies with type of conveying material as given in Table 3. These values are based on total length of pipeline.
| Conveying material | Pressure drop [kPa] | Air mass flow rate[kg/s] | Solids mass flow rate[kg/s] | Solids loading ratio[-] | Optimum specific power consumption[kW/{kg/s}] | Optimum power consumption coefficient[-] |
| Fly ash | 247 | 0.0257 | 1.263 | 49.1 | 4.31 | 0.732 |
| Alumina | 277 | 0.0361 | 2.06 | 57.1 | 3.96 | 0.651 |
However, these values are calculated considering total length of conveying pipeline and these values are quite different as compared to calculated values considering a section of pipeline. For example, optimum power consumption coefficient for fly ash considering total length is 0.732 and considering a 2 metre length at the beginning of pipeline it is 0.697.
Some authors suggested a minimum value of certain parameter as a boundary for fluidised dense phase conveying. Mallick and Wypych (2009) suggested different values for the Froude number at the entry of the pipeline which represented the minimum transport boundaries of different conveying materials. In addition to this, these values were also different for different conveying materials.
The minimum Froude number represents a magnitude of minimum conveying velocity. Similar to minimum Froude number, optimum power consumption coefficient can also be considered as a boundary of conveying.
The value of η is also dependant on conveying material properties. So effectiveness of any conveying test can be assessed by comparing optimum value of η with the predicted value of η for given values of Fri and φ.
7 Conclusion
The work presented in this article is aimed at correlating the pneumatic conveying parameters with non-dimensional power consumption by using experimental data of different conveying materials.
A correlation for non-dimensional power is developed considering the most influencing non-dimensional parameters, including solids loading ratio and inlet Froude number. The correlation is found to be in good agreement with the experimental data.
Variation of steady state parameter and transient parameter along the length of pipeline also suggests that there is correlation between these two parameters.
■