
2.2 Effect of Moisture on Bulk Strength and Density

Changes in moisture content can significantly influence the strength of bulk solids. By way of illustration, the critical cohesive arching dimension B for a stainless steel lined hopper containing three Hunter Valley coals plotted as a function of moisture content are shown in Fig. 4.
Sample (1) is a raw open cut coal, Sample (2) a washed version of Sample (1), and Sample (3) a blend of Sample (2) with another washed coal. The high strength of Sample (1) is clearly evident. Experience has shown that the peak bulk strength of virtually all bulk solids including coal may occur at a moisture content somewhere between 70 and 90% of the saturation limit. Washed coals such those illustrated by curves of Samples (2) and (3) in Fig. 3 generally exhibit very little, if any, increase in bulk strength due to time storage.
Bulk density tests performed on many coal types have shown that, almost invariably, the bulk density is a minimum at the moisture content for which the bulk strength is a maximum. This is illustrated for a coal sample in Figs. 5 and 6.

Fig. 5: Influence of moisture content on bulk density for a coal sample.
|

Fig. 6: Influence of moisture content on bulk strength for a coal sample.
|
2.3 Effect of Vibrations on Strength and Flow

The application of mechanical vibrations to promote gravity flow of bulk solids has been studied by Roberts [7]. A dynamic shear test apparatus was developed which allows vibrations to be applied to a shear cell as shown in Fig. 7. The tests permit the shear strength to be determined in the presence of vibrations which may be applied over a range of amplitudes and frequencies.
The strength of bulk solids is measured in terms of the unconfined yield strength σc which is related to the major consolidation pressure σ1 by the yield locus and Mohr diagram as illustrated in Fig. 8. This Figure shows two yield loci, a non-vibrated yield locus for which the unconfined yield strength σc corresponds to the major consolidation pressure σ1. For the same consolidation conditions, the application of vibrations during shear leads to the vibrated yield locus and the unconfined yield strength σcf. The unconfined yield strengths σc and σcf give one point on the respective flow functions shown in Fig. 9. A family of yield loci, for at least three consolidation conditions, needs to be obtained for the complete flow functions of Fig. 9 to be determined.

Fig. 8: Vibrated yield loci.
|
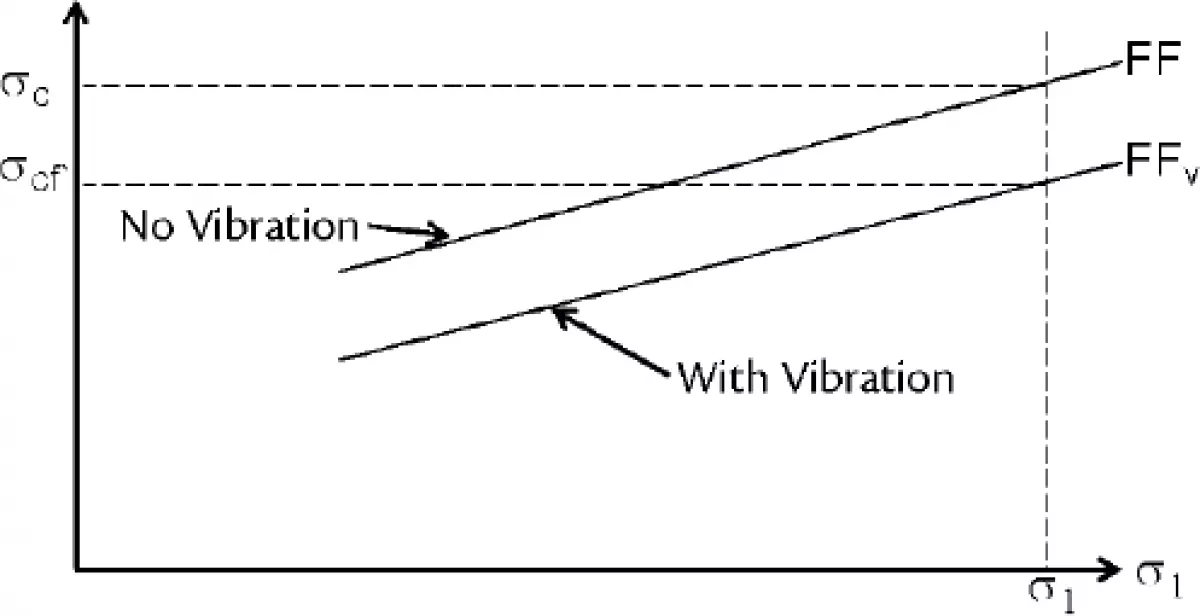
Fig. 9: Flow functions.
|
It has been shown that the dynamic shear strength decays exponentially with increase in vibration velocity in accordance with the relation:

|
(1) |
where:
- ƒ is the frequency (Hz), and
- τ∞ is a constant, and
- U is another constant.

For a given solids, the constants τ∞ and U depend on the consolidation and normal pressure applied during shear.
The decay in shear strength is illustrated in Fig. 10. The constant U in Eq. (1) is referred to as the bulk solid vibration velocity constant.
Experimental evidence to date suggests that U is independent of the consolidation pressure and applied normal pressure. By way of example, U is approx. 7 mm/s for a refractory clay pyrophyllite and 10 mm/s for a typical iron ore. If U is known for the particular bulk solid, the values of relative amplitude Xr and frequency ƒ for maximum reduction in shear strength may be estimated from Eq. (2):

|
(2) |
It should be noted that the decay in shear strength with vibration velocity as described above is similar to the decay in shear strength with voidage on the shear plane. This implies that the vibration velocity (or energy) is directly related to the voidage.
