
(From the archive of ”bulk solids handlingshowthread.php?32098 About the bulk solids handling journal and this archive", article published in Vol. 35 (2015) No. 3 , ©2015 bulk-online.com)
Introduction
The dimensioning of belt conveyors, in particular the determination of the power consumption of their drive systems, requires the knowledge about the occurring motion resistances. The term motion resistance is used as an equivalent for all forces which act on the conveyor in or against conveying direction [4]. The German standard DIN 22101 [5] classifies the occurring motion resistances in primary, secondary, gradient and special resistances. For the calculation of these resistances DIN 22101 suggests the use of the virtual resistance coefficient ƒ. The DIN uses an approximate approach for a relatively simple calculation of the motion resistances. But the resistances can be calculated more precisely using the approach from Vierling [6] and Lachmann [7]. In this approach the primary resistances are divided into the idler roll rotating resistance, the indentation rolling resistance and into the belt and bulk solid flexure resistance. The belt and bulk solid flexure resistance can be theoretically calculated but are hard to measure. Often the flexure resistance is indirectly measured via the subtraction of the idler roll rotating resistance and the indentation rolling resistance from the total measured motion resistance. A separation of the total flexure resistance into the parts caused by the belt or bulk solid is even harder.The continuous deflection of the belt and the plastic deformation of the bulk solid during the transport process result energetically in a higher power requirement. According to the appendix of DIN 22101 and based on the analysis of a horizontal belt conveyor the bulk solid flexure resistance represents 18% and the belt flexure resistance 5% of the total motion resistance.
1. Bulk Solid Flexure Resistance
1.1 Theoretical Background
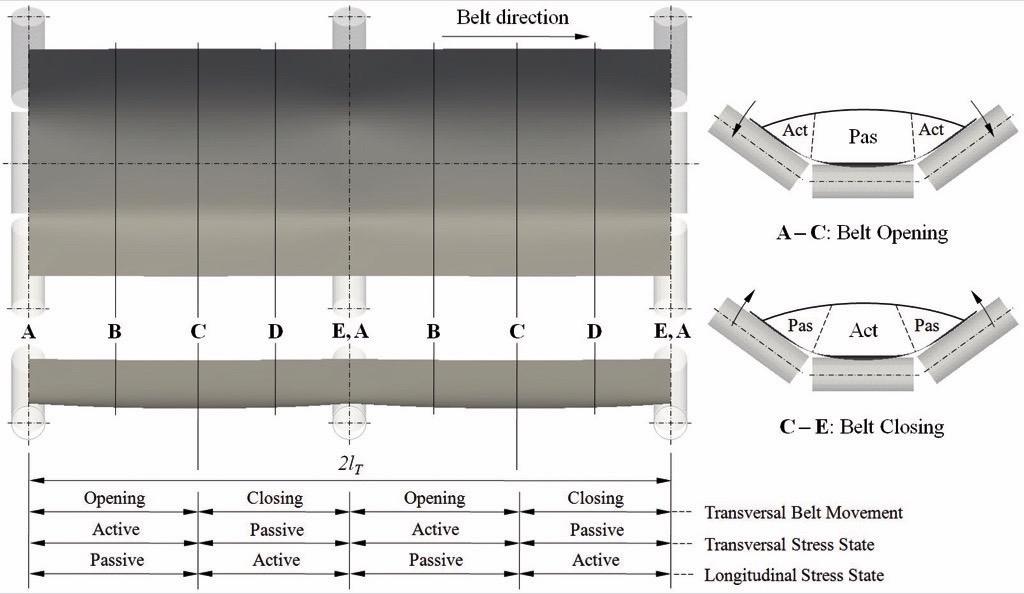
The bulk solid flexure resistance should be analysed in more detail for a short belt section supported by fixed idler stations with three idlers as shown in Fig. 1. The belt opens when it leaves the idler station until approx. half of the idler distance is reached (A-C). At this point the maximum deformation of the belt cross section is reached. Due to the mass of the belt, its bending resistance and the bulk solid load the belt tries to reach the flat unloaded and un-deformed initial state. This is counteracted by the “imposed” troughing of the belt by the shape of the supporting idler stations in connection with the belt pre-tensioning. The belt movement from the point of the maximum defor-mation to the next idler station is called belt closing (C-E).The opening and closing of the belt is associated with the occurrence of active and passive stress states in the bulk material. These conditions occur not only in the transverse direction in the cross section but also in the longitudinal direction at a distance lT between the carrying idlers. This process causes a continuous loosening-up (active state of stress) of the bulk material followed by a compaction (passive state of stress).The bulk solid flexure resistance depends on the current stress state, or more precisely, on the superposition of the stress states in longitudinal and transverse direction (Fig. 1). The plastic deformation of the bulk material starts at the point of the maximum belt deflection and ends at the idler station. The deformation imposes the overcoming of the internal friction of the bulk material. Wheeler could clearly show in [2], that this bulk property influences strongly the occurring bulk solid flexure resistance. An increasing internal friction increases the bulk solid flexure resistance. Beside the internal friction coefficient the wall friction has also a significant influence.
The longitudinal deformation of the belt results in the maximum sag zmax which depends on the belt load caused by
- the belt meter weight qBelt and the bulk meter weight qBulk acting on the idler distance lT , and
- the pretension of the belt, Fpre.
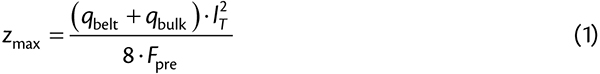
According to DIN 22101 the maximum sag can be calculated as
 |
This approximate formula based on the parabolic equation for the cable sag can be used for the relatively low sag ratios in industrial practise of zmax/lT ≤ 0.02 [8]. The given equation is used in the empirical approach for the calculation of the flexure resistance published by Lachmann [7], van Leyen [9] and Hettler [8]. Additionally the belt velocity vBelt needs to be considered in the calculation of the flexure resistances.The given relation in Eq. (1) considers only the two-dimensional longitudinal belt deformation along the belt symmetry line. The transversal deformation is not considered. Already Behrends measured in [10] the opening of the belt profile depends on the load situation and the pre-tensioning of the belt. However, these results were hard to implement in a fully analytical approach. Hence, the determination of the global three-dimensional belt deformation and the linked flexure resistances was limited to several test rigs only.Today, the use of modern numerical methods should allow the prediction of the deformation behaviour as well as the flexure resistances, particularly the bulk solid flexure resistance.
1.2 Recent Studies
The deformation of the belt can be simulated using the Finite Element Method (FEM). The papers [11] and [12] show how the FEM can be used for the prediction of the deflection of an unloaded pipe conveyor.Wheeler could simulate in [2] the three-dimensional deformation of a belt with fixed idler stations using a finite difference approach. For the consideration of the interaction between belt and bulk material Wheeler used a continuums approach according to Krause and Hettler [1]. Krause and Hettler introduced already in 1974 the use of an extended Coulomb theory for the description of active and passive stress states occurring in the belt cross section. But Limberg could show in [13] that the normal bulk load on the middle idler calculated with the analytical approach in [1] is smaller than experimentally measured. Exactly the opposite is true of the normal load on the side idler. This is confirmed by Ilic who compared in his work [3] experimental results for four bulk materials with the analytical approach.The complex interaction of the bulk material and the deformable belt during the transport process limits the use of the continuum approaches for the prediction of the bulk loads. The Discrete Element Method (DEM) is an alternative numerical approach to simulate the contact forces between bulk material and belt.Already Mustoe and Bin [14] tried to qualitatively determine the bulk solid flexure resistance as energy losses which increase with increasing sag ratio. For this three fixed deformation scenarios of a belt section between two idler stations were generated as a surface model. The longitudinal belt sag was predicted using a semi-analytical approach published by Spaans [15]. For the transversal deflection it was assumed that the belt edges show the same maximum sag like the belt center line. The average power consumption was measured in three simulations with constant mass flow rate and normalized with respect to the first simulation. Out of the linearly increasing normalised belt sag (1,2,3) results an progressive increase of normalized power consumption (1, 2.45, 3.92). It has to be mentioned that the simulations considered quite large particle diameters dP ≈ 51 mm. The work of Mustoe and Bin was a first step but it is not fully satisfying due to the fact, that the belt deformation was fixed and independently defined from the occurring bulk stress. Also the transversal belt deflection was much idealised.A fully numerical approach must combine the advantages of the FEM and DEM to simulate the real interaction between belt and the bulk material. With such an approach no further analytical assumption or prerequisites are necessary. Hence, a coupling between the two simulation methods was developed.
2. Coupled FEM-DEM Simulations
2.1 Recent Studies
The theoretical background of the presented FEM-DEM coupling based on the commercial codes ANSYS Classic (FEM) and PFC3D (DEM) was already described in detail in [16] and [17]. The validation of the coupling algorithm was done via the analysis of the static belt deflection of a pre-tensioned belt segment loaded with bulk material in simulation and experiment. The experimental tests were undertaken at the Centre for Bulk Solids and Particulate Technologies (CBSPT) of The University of Newcastle, Australia. Steel cord belts and fabric belts were tested. Like in the work of Wheeler [2] the belt was considered in the FEM via a linear orthotropic material model with different bending stiffnesses in longitudinal and transversal direction. The results of the validation were published in detail in [18]. A very good correlation between simulation and experimental results could be found. It was shown, that not only the longitudinal deflection of the belt along the centre line was closely predicted by the coupled simulation but also the global deflection of the belt surface between the idler stations.Based on these validation results the simulation model was extended to measure the bearing forces on a fixed idler station with three idlers. The base for the further investigations was the conveyor test rig of Hettler [8]. The aim of the research was the direct comparison of the simulation results with the experimental findings published in [8]. The most important parameters of Hettler’s test rig are summarised as follows:
- Belt width: B = 800 mm (fabric belt)
- Idler station distance: lT = 1 m
- Troughing angle: α = 36°
- Idler roller diameter: d1 = 108 mm
- Idler length: l1,2 = 315 mm
The new investigation covered several simulations. The following parameters were varied:
- Belt pre-tension: Fpre = 5…20 kN
- Belt velocity: vbelt = 1…6 m/s.
Hettler used cohesionless grit with the following parameters for his experiments.
- Bulk density: ρb = 1400 kg/m³
- Particle size distribution: dP = 2…20 mm
- Angle of internal friction: φ = 40°
- Wall friction angle against the belt: φw = 27°
- Dynamic angle of repose: φaor,dyn = 15°
The particles in the DEM simulation are idealised as spherical particles. The real particle size distribution could not be considered due to the limitation of the calculation time which is directly dependent on the particle number. Hence, the simulation model considered particles with a size of dP = 15…20 mm. The mass of the neglected fine fraction is added to the smallest considered fraction in the simulation. The particle density was scaled to consider the more porous material in the simulation and to realise the real weight of the bulk material in a completely filled cross section of the belt. In extension to the simulation model presented already in [16] and [17] three idler stations with three idlers each and a belt section with a length of 2·lT were considered. The middle idler station was used for the measurements.
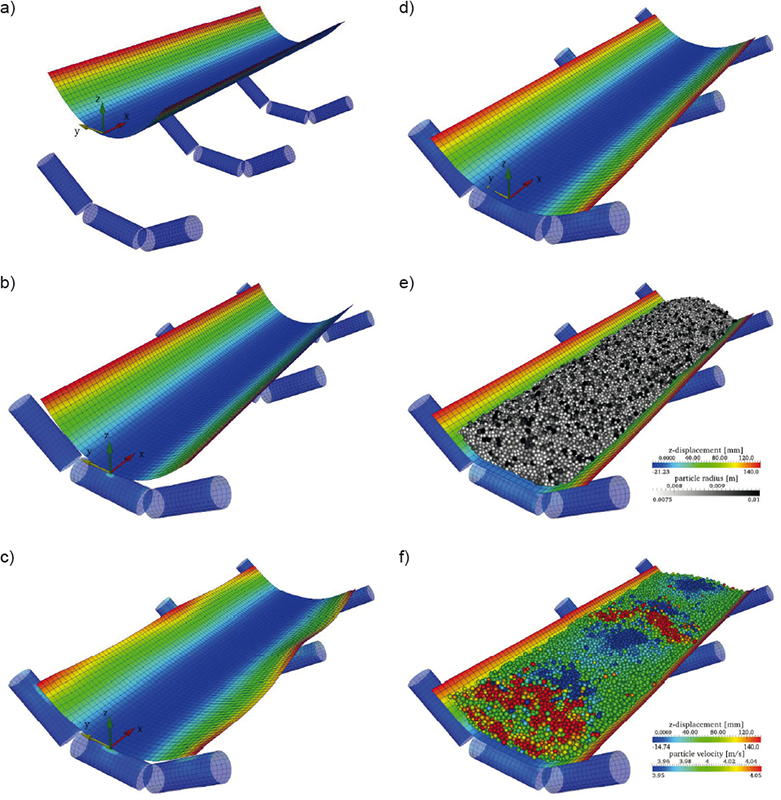
In the first step of the simulation the belt section is pre-deformed according to the troughing geometry of the idler station. Furthermore the weight of the belt itself is considered for the calculation of the belt deflection (Fig. 2a). In the second and third step the contacts between belt and idlers are initialized (Figs. 2b, c). Next, the pretension force is applied to the belt (Fig. 2d), followed by the loading of the belt with the bulk material in the fifth step (Fig. 2e). In the final step the actual conveying process is started as well as the measurement of the idler forces. A continuous conveying process can be simulated by the help of periodic boundaries in conveying direction. The coupled FEM-DEM simulation itself is based
- on the transfer of the load data from the DEM to the FEM and
- on the transfer of the newly calculated deformed belt surface from the FEM to the DEM.
Additional information about the coupling is given in [16] and [17].The analysis of the bearing forces are done for stationary conditions during t = 3.5…13.5 s. The average forces of the simulations with varying parameters are compared to the analytical results of Krause and Hettler [1]. They show a principally good correlation and are discussed in more detail in [20]. Nevertheless, two important differences could be clearly identified. In the simulation the radial forces on the middle idler are 3-11% higher whereas the forces on the inner bearing of the side idler are 25-40% smaller in comparison to the analytical approach. The total load of the idler which can be calculated based on the bearing forces behave in the same way.These results confirm the findings of Limberg [13] and Ilic [3] as described before. Ilic undertook experimental tests on a conveyor plant with a belt width of 600 mm, an idler distance of 1.2 m and a troughing angle of 35°. A flexible TecScan sensor pad was used to measure the bulk load on the belt during the conveying. A fixed belt velocity of 1.5 m/s was used in all of Ilic’s tests. Due to the different dimensions of the belt conveyor the extrapolated test results of Ilic cannot be directly compared to the results of Krause and Hettler or to the results of the FEM-DEM simulation. This problem can be solved with the introduction of belt load ratio ζ which considers the normal load of the middle idler FF2N and the load of the side idler FF1N.
 |
Fig. 3 shows the comparison of the calculated load ratio of all three approaches.
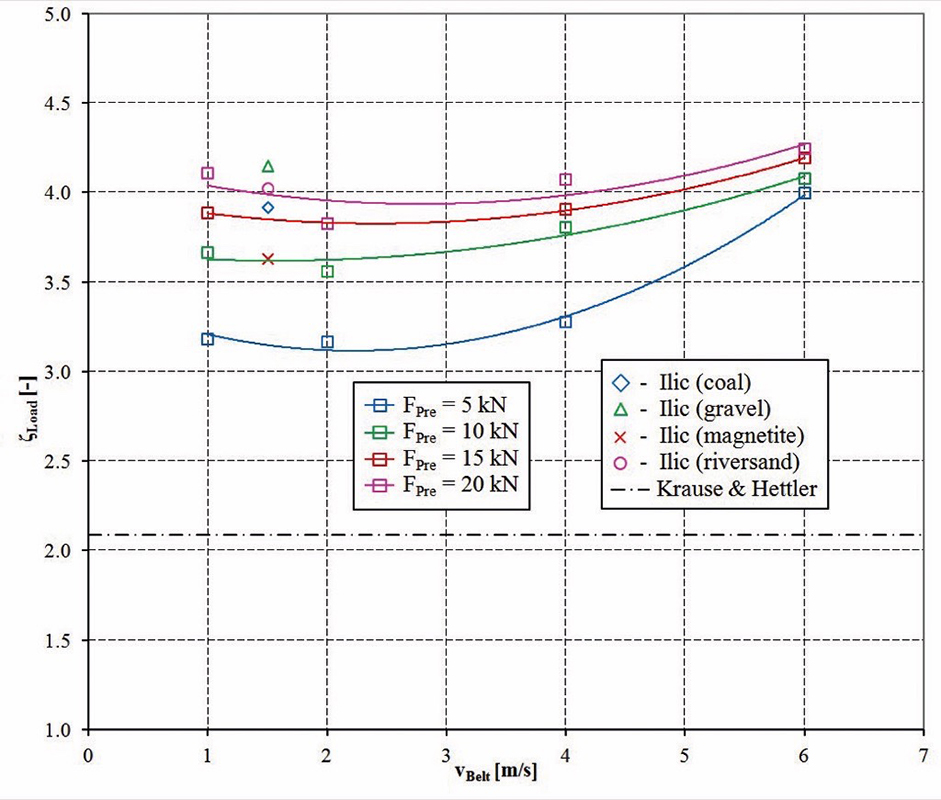
The simulation results in Fig. 3 show the influence of the belt velocity and the belt pretension on the load ratio. In Krause and Hettler’s approach neither the belt velocity nor the belt pretension is considered. Ilic measured the load ratio for one fixed belt velocity only. The belt pretension was also not further specified in [3]. However, the comparison of the simulation results and the results of the experimental tests from Ilic show a good correlation while the load ratio according to Krause and Hettler is much smaller. Hence, the FEM-DEM simulation allows a realistic prediction of the idler load and the three dimensional belt deflection.
2.2 Simulation Model of Bulk Solid Flexure Resistance and Qualitative Results
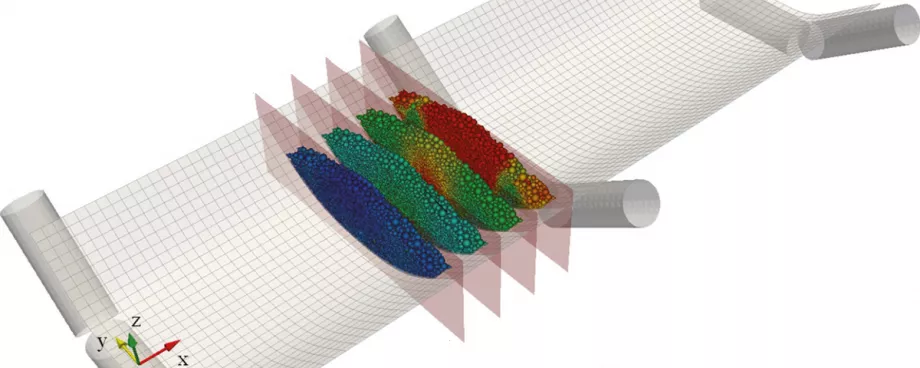
The particle behaviour during the movement through the idler stations should be further investigated for a detailed analysis of the bulk solid flexure resistance. Therefore the simulation model is reduced to a 50 mm wide slice of bulk material on the belt as shown in Fig. 4. The slice moves in conveying direction (+x-direction) along a belt section with the length of 2·lT. The slice is limited with frictionless walls towards ±x-direction. These additional walls move together with the slice over the belt. The reduction of the simulation model allows the consideration of a more realistic particle size distribution of dP = 5…20 mm. Further, the model enables a time dependent analysis of the local acting forces and the bulk material behaviour. During the simulation the sum of all contact forces acting in conveying direction on the belt surface is recorded. The total contact force which changes according to the position of the slice is used for the analysis of the motion resistances caused by the deformation of the bulk material.Fig. 4 shows the motion of the bulk material in the cross section by the help of particle colouring according to the particle velocity in the yz-plane. Four different cross sections show how the material is compressed during its move through the idler station.
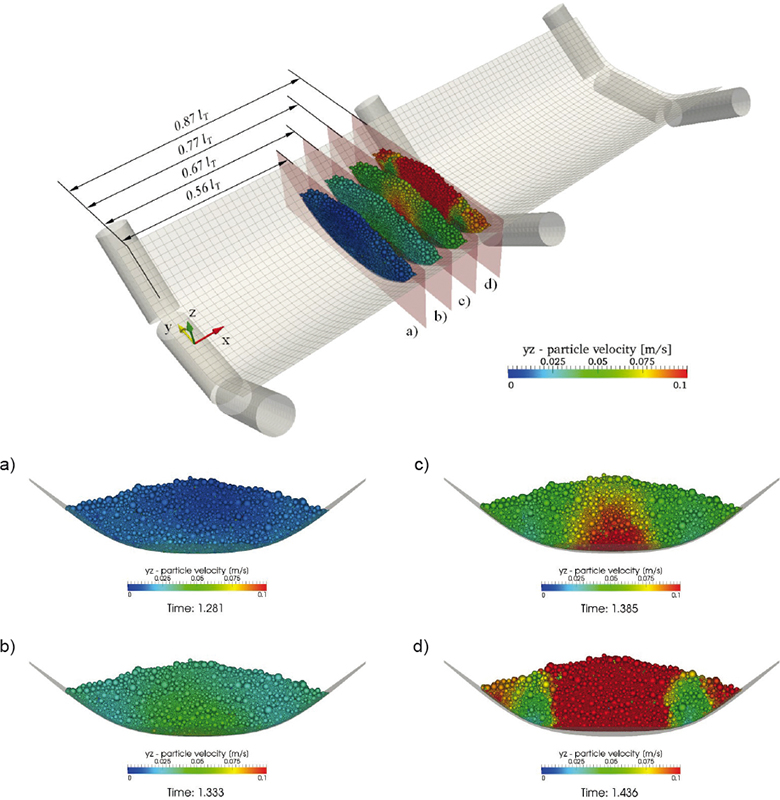
The used belt deflection in the simulation was calculated before via coupled FEM-DEM simulation for the same belt speed and pretensioning as explained in the above section. One remarkable result of this analysis is that the belt deflection between two idler stations is not symmetric. Hence, the maximum belt sag occurs not at a position of 0.5·lT but is shifted towards the next idler station. Fig. 4a shows the cross section at the maximum sag at 0.56·lT. In the position the particle velocity in the yz-bulk material which means that the highest degree of the loosening-up is reached. After this point the slice moves forward to the positions 0.67·lT (Fig. 4b) and 0.77·lT (Fig. 4c). It can be seen that the particles are much more accelerated in the centre of the belt than at its sides. This results from the higher sag in the belt centre line due to the non-uniform deflection of the belt in the cross section. During this movement the stress condition in the bulk material changes from an active to a passive stress state. Shortly before the idler station is reached, the cross section at 0.87·lT (Fig. 4d) shows again that the material at the centre of the belt is more accelerated. At this point also the particles at the outer side of the cross section show higher particle velocities. The lowest particle velocities can be seen in the area of the belt bending points. This is caused by the relatively low transversal deflection of the belt in this area.Remarkable in Fig. 4d are also the sharp boundaries of the particle velocities. Hence, it is very obvious that shear bands must occur at these boundaries. In reality yield lines can be observed in these areas especially for cohesive materials. This behaviour was already described by Ilic in [3]. Figs. 4a-d show that the shear bands have no constant inclination angle during the change from active to passive stress conditions. The shear bands orientation changes during the move through the idler stations. Fig. 4d shows clearly that four shear bands can be identified in the cross section, not only two as described in [1] and [2]. Considering the three dimensional nature of the problem, not only two dimensional shear bands or lines occur but bended shear surfaces are established in the bulk material. The characteristic of the shear surfaces is strongly dependent on the bulk material properties.
2.3 Quantative Simulation Results
Figs. 5-8 show the summed contact forces in x-direction depend on the distance between two idler stations lT. Positive contact forces between particles and walls can be interpreted as motion resistance which act against the conveying direction. The force peaks at 0.87…0.9·lT describe the forces which occur if the slice of bulk material moves through the troughed area of the idler station. During conveying of a material bed these forces occur constantly over time on every single idler station and increase the power consumption of the drive.
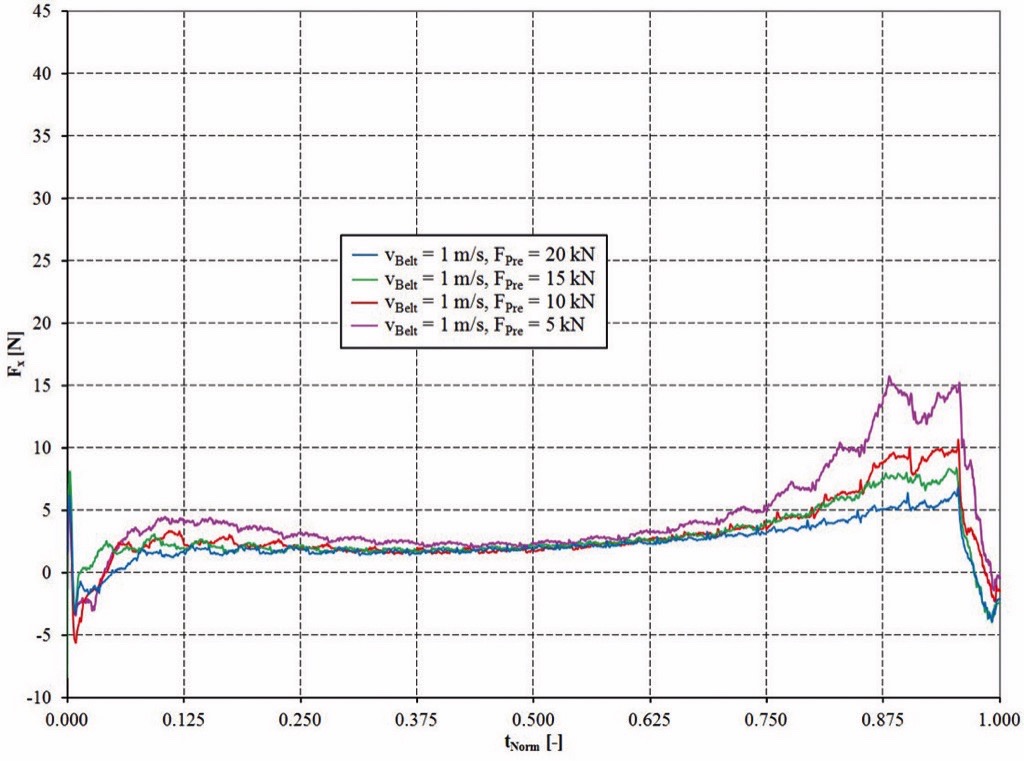
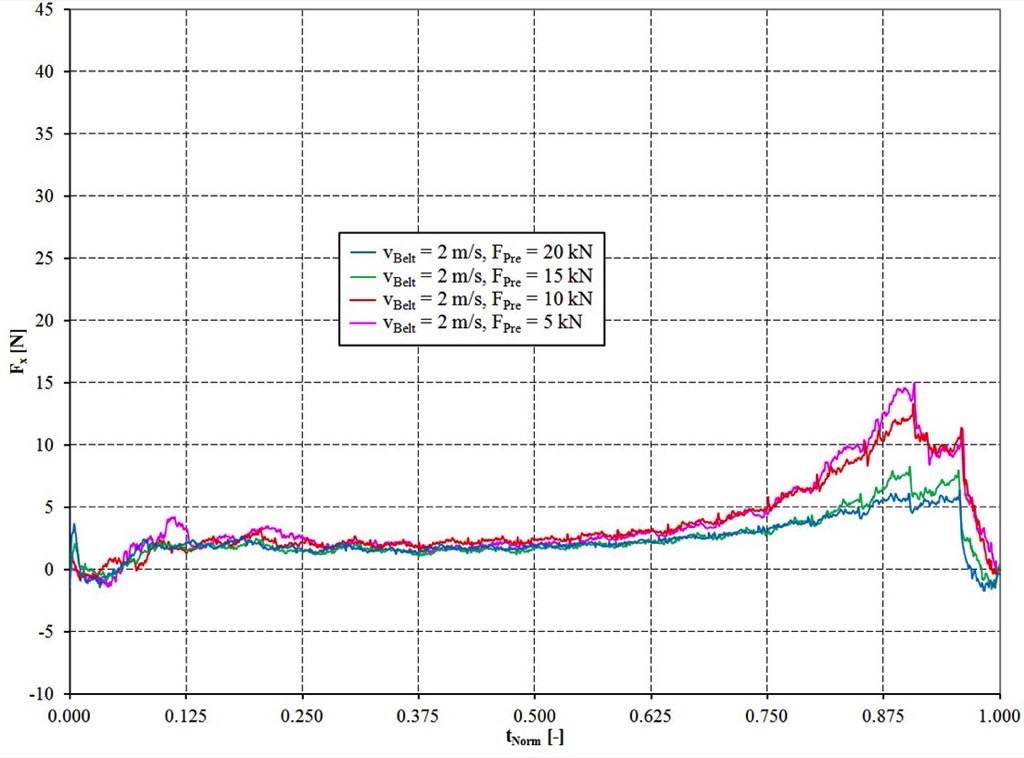
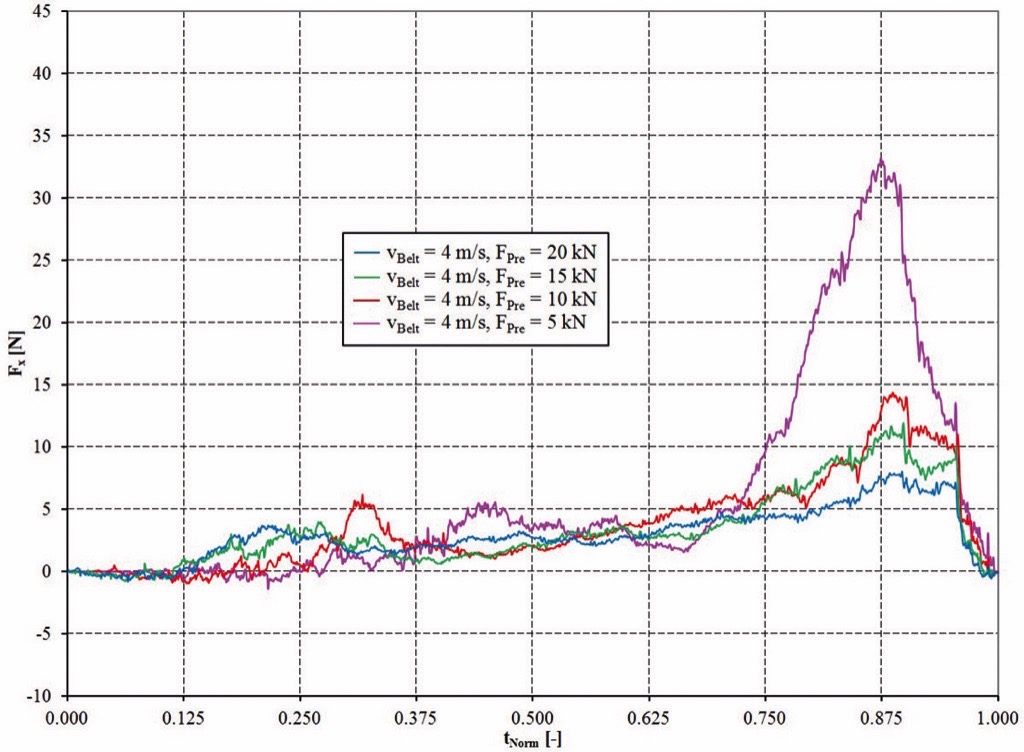
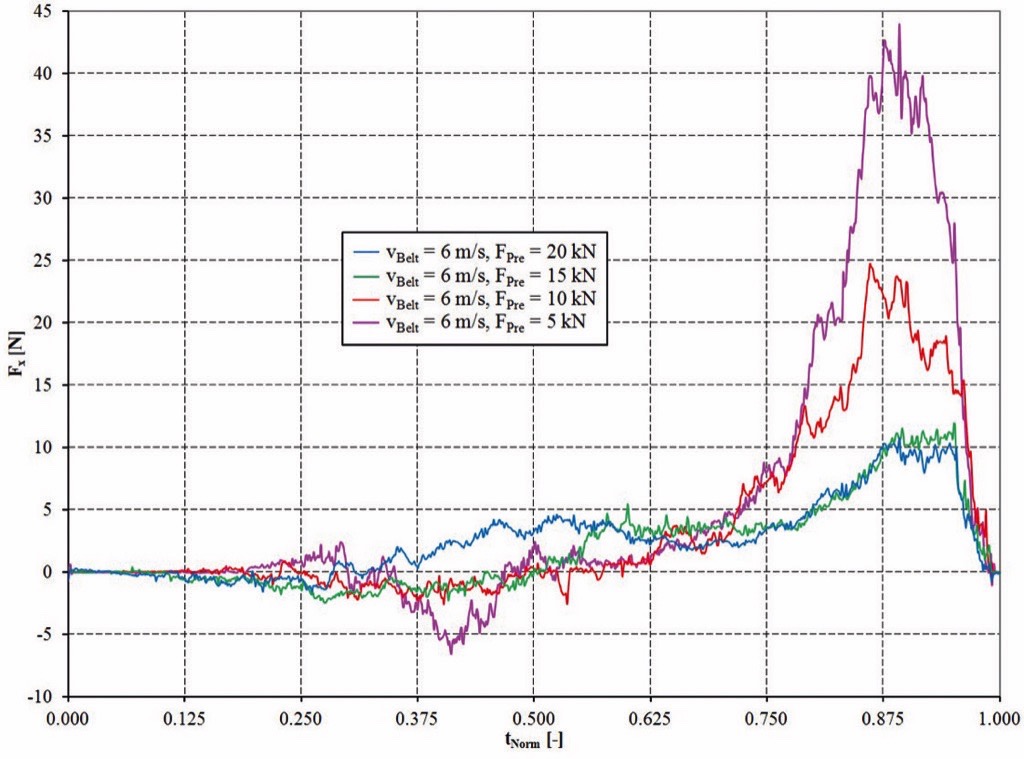
The measured total force in the simulation can be interpreted as the bulk solid flexure resistance and is caused by:
- The compaction of the particles and the resulting forces during the movement through an idler station. The occurring forces in the simulation depend on the particle - particle friction μP (Coulomb friction) and the particle rolling friction μR. Both microscopic simulation parameters result in a macroscopic internal friction value for the virtual bulk material. The compaction is identical with the deformation of the bulk material due to the deformation of the belt.
- The friction between the particles and belt inner surface. This influence is described in simulation as well as in reality by the wall friction value.
- The chosen particle size distribution.
To allow the use of the force diagrams also for different settings for the belt velocity and the idler distance a normalised time tNorm was introduced. tNorm = 0 means that the slice of bulk material left the first idler station and tNorm = 1 means that the slice reached the next idler station. Due to the fact, that the considered idler distance in the slice simulation was set to lT = 1 m the numerical value of tNorm is equal to the position of the slice between the two idlers.As expected, the highest bulk solid flexure resistances can be observed for high belt velocities and small pretension forces. It has to be mentioned, that the sag ratio for the smallest pre-tension force of 5 kN is with zmax/lT > 0.025 quite high compared to the used values in practice. Despite a resulting trajectory with higher “throw distance” of the bulk material these values should be considered for the further interpretation because they mark a tendency of how these parameters influence the bulk solid flexure resistance.The forces as shown in Figs. 5-8 are almost zero until the slice reached the position of the maximum belt sag. The forces increase for a slice position > 0.5·lT. The maximum force is reached in the position of 0.87…0.9·lT. Then the forces decrease rapidly and can reach even negative values. Hence, it can be confirmed that the “contact point” with the idler is shortly before the yz-symmetry plane of the idler station is reached. The decreasing forces after 0.9·lT confirm the assumption that bulk material lifts off the belt surface even with low belt velocities and high pre-tension forces. However, the “throw distance” are very small and the lift off can hardly be observed visually.The directly measured forces shown in Fig. 5-8 should be evaluated more qualitatively than quantitatively due to the reduction of the simulation model to a slice of the bulk material which moves along the belt. To allow a quantitative evaluation despite the model idealisation, the maximum forces at the position of 0.87…0.9·lT are normalized to the smallest maximum forces for the configuration vBelt = 1 m/s and Fpre = 20 kN. A similar method was already used by Mustoe and Bin [14]. The so calculated normalized forces FNorm are shown in Fig. 9 depend on the belt pretension and in Fig. 10 depend on the belt velocity.Hettler derived an analytical equation for the flexure resistance based on his investigations [8]. This approach given in Eq. (3) is of special interest for practical sag ratios of zmax/lT ≤ 0.02 and can be used for an evaluation of the determined normalized forces FNorm in the simulation.
Whereas FB is the belt weight and FL is the weight of the bulk material for the distance of lT. In [8], Hettler extended Eq. (3) to consider the belt velocity as follows.
The so called velocity factor was defined in [8] as cv = 0.1. Eq. (4) allows the calculation of the total flexure resistance as the sum of the belt flexure resistance and the bulk solid flexure resistance.To allow a rough estimation of the bulk solid flexure resistance only, the ratio between total motion resistance, belt flexure and bulk solid flexure resistance as given in the appendix of DIN 22101 can be used (see section 1). The so calculated values from Hettler’s work were similarly normalized like the forces in the simulation and are shown in Figs. 9 and 10.
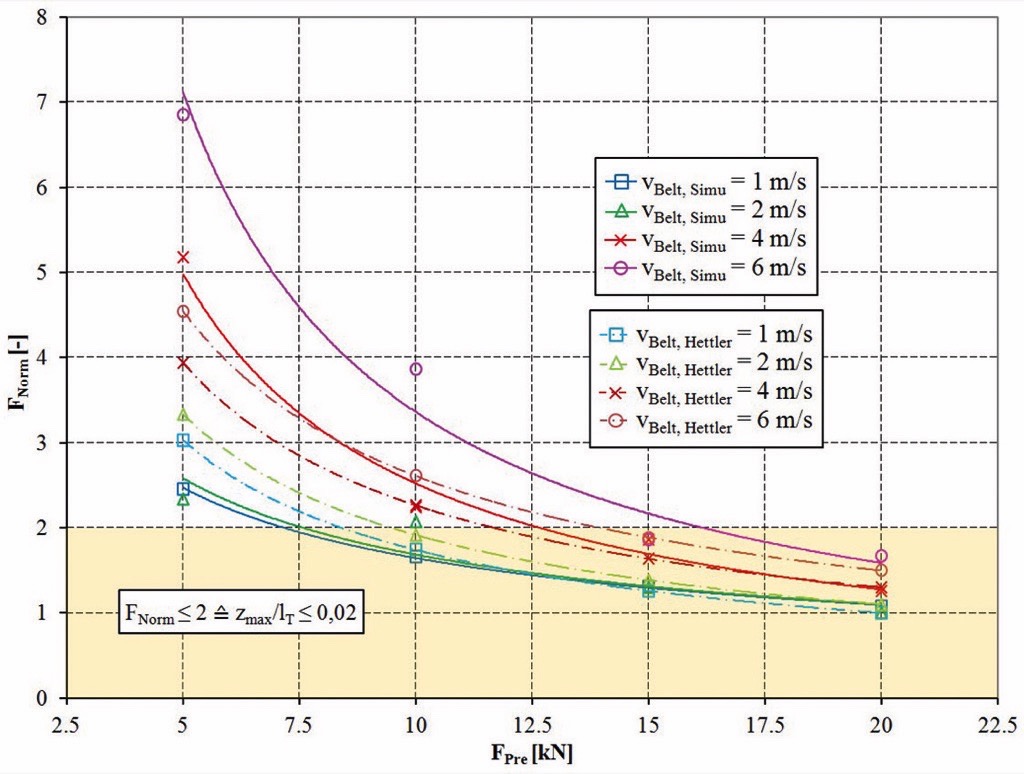
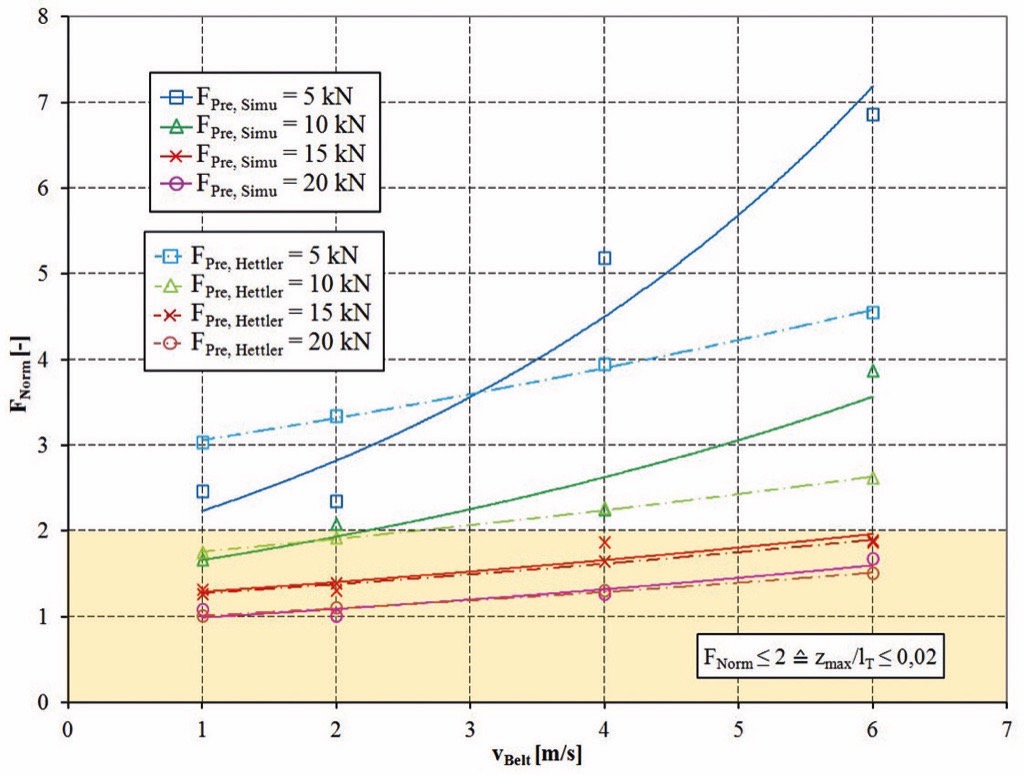
Summarizing the results in Figs. 9 and 10 it can be stated, that the bulk solid flexure resistance (which is symbolised via the FNorm value) increases strongly and non-linearly with decreasing belt pretensioning and increasing belt velocities. In this scenario the bulk solid flexure resistance can double its value for belt sag ratios from practical importance (zmax/lT < 0.02). For these belt sags the dependence of FNorm from the pretension force is almost linear.For high belt pretensions FNorm is increasing almost linearly with the belt velocity (Fig. 10). Only for lower pretension forces the normalised force shows a non-linear increase with increasing belt velocity.The comparison of the simulation results with the empirical approach according to Eq. (4) shows a very good correlation especially for high pretensions and the most parameter settings which result in belt sag ratios of zmax/lT ≤ 0.02. For these belt sag ratios Hettlers’s approach also had very good correlation with experimental findings. This means that also the simulation results are in very good correlation with these experimental results.A significant difference to Hettler’s approach can be observed for low pretensions. For these settings the simulation results tend to be closer to Hettler’s experiments as far as a comparison is possible based on the published data in [8].
3. Conclusion and Outlook
Coupled FEM-DEM simulations allow the prediction of the global three dimensional belt deformation caused by the bulk material load. A unique look inside the bulk material behaviour during the movement through an idler station was presented and analysed in detail. Also the forces acting on the idler stations could be measured with the new simulation approach. The realistically deformed belt surface is one major requirement for the calculation of the bulk solid flexure resistance. The quantitative results of the presented investigations were used for a comparison with the many findings of Hettler published in [8]. It was found, that the simulation results are in very good agreement with Hettler’s results for practically important belt sag ratios of zmax/lT < 0.02.For these belt sag ratios the bulk solid flexure resistance may not more than double depend on the chosen parameter setting. Also the results for belt sag ratios > 0.02 are interesting due to the fact, that these values may be more common in other parts of the world according to CEMA [19].Additional work needs to be done to consider the effect of different trough angles, larger idler distances and larger belt widths. Especially the last two parameters are interesting for the investiga-tion of scaling effects. The ongoing research work is currently focusing on the development of a method to analyse the bulk solid flexure resistance without the presented slice approach. Increasing computational power will allow such an analysis for even the biggest belt conveyors and for a much finer particle size distribution than presented. Also cohesive material will be considered in future simulations.
Nomenclature
| B | Belt width, mm |
| FB | Belt weight, N |
| FF1N | Normal load on the side idlers according to [1], N |
| FF2N | Normal load on the middle idler according to [1], N |
| FL | Weight of the bulk material, N |
| FPre | Pretension of the belt, N |
| U’’BL | Flexure resistance according to [8], N |
| U’’BL(v) | Flexure resistance according to [8], N |
| d1 | Idler diameter, mm |
| dP | Particle size, mm |
| cv | Velocity factor for the flexure resistance according to [8], s/m |
| ƒ | Virtual resistance coefficient according to the Germanstandard DIN 22101 [5], - |
| l1,2 | Idler length, mm |
| lT | Idler distance, m |
| qBelt | Belt meter weight, N/m |
| qBulk | Bulk meter weight N/m |
| tNorm | Dimensionless normalised time for the movement of a slice of bulk material from one idler to the next, - |
| tSim | Simulation time, s |
| vBelt | Belt velocity, m/s |
| zmax | Maximum belt sag in longitudinal direction, mm |
| α | Troughing angle of the belt, ° |
| ζ | Load ratio between the load on the side and middle idler, - |
| μ | Internal friction value, - |
| μw | Wall friction, - |
| ρb | Bulk density, kg/m³ |
| φ | Angle of internal friction, ° |
| φaor,dyn | Dynamical angle of repose, ° |
| φw | Wall friction angle, ° |
References:
- Krause, F., and W. Hettler: Die Belastung der Tragrollen von Gurtbandförderern mit dreiteiligen Tragrollenstationen infolge Fördergut unter Beachtung des Fördervorgangs und der Schüttguteigenschaften; Wissenschaftliche Zeitschrift der Technischen Hochschule Otto von Guericke, Magdeburg, 18 (1974) Heft 6/7. pp 667-674.
- Wheeler, C.A.: Analysis of the Main Resistances of Belt Conveyors; PhD Thesis, University of Newcastle, Australia, 2003.
- Ilic, D.: Bulk Solid Interactions in Conveying Systems; PhD Thesis, University of Newcastle, Australia, 2013.
- Geesmann, F.: Experimentelle und theoretische Untersuchungen der Bewegungswiderstände von Gurtförderanlagen; Dissertation, Universität Hannover, 2001.
- [5] DIN 22101. Gurtförderer für Schüttgüter – Grundlagen für die Berechnung und Auslegung. August 2002.
- [6] Vierling, A.: Untersuchungen über die Bewegungswiderstände von Bandförderanlagen; f+h - Fördern und Heben 6 (1956), Nr. 2, S. 131-142 and f+h - Fördern und Heben 6 (1956), Nr. 3, S. 249.
- Lachmann, H.-P.: Der Walkwiderstand von Gummigurtförderern; Dissertation, Technische Hochschule Hannover, 1954.
- Hettler, W.: Beitrag zur Berechnung der Bewegungswiderstände von Gurtbandförderern; Dissertation, Technische Hochschule Otto von Guericke Magdeburg, 1976.
- van Leyen, H.: Der Tragrollenabstand bei Gummigurtförderern und sein Einfluss auf die Gurtbeanspruchung und die Laufwiderstände; Deutsche Hebe- und Fördertechnik 8 (1962); Nr. 2, S. 53-56; Nr. 3, S. 93-96; Nr. 4. S. 147-152; Nr. 5, S. 213-218; Nr. 6, S. 251-256.
- Behrens, U.: Untersuchungen zum Walkwiderstand schwerer Förderbandanlagen; Dissertation, Technische Hochschule Hannover, 1967.
- Schilling, O., M. Westerwald and J. Wiedenroth: ABAQUS FE Analysis of a Pipe Conveyor using Solids with Embedded Truss Elements and Shells with Rebar Layers; NAFEMS Seminar “Simulating Composite Materials and Structures”, Bad Kissingen, Germany, 2007.
- Pang, Y., and G. Lodewijks: Test and Simulation of Pipe Conveyor statics; Bulk Solids Europe, 4th International Conference & Exhibition, Conference Proceedings B6.1, Berlin, 2012.
- Limberg, H.: Untersuchung der trumbezogenen Bewegungswiderstande von Gurtförderanlagen; Dissertation, Universität Hannover, 1988.
- Mustoe, G., and R. Bin: Discrete Element Modeling of Sag Energy Losses in a Conveyor Belt System; SME Annual Meeting, Salt Lake City, 2008.
- Spaans, C.: The Calculation of the Main Resistance of Belt Conveyors; Bulk Solids Handling Vol. 11 (1991) No. 4, pp. 809-826.
- Dratt, M., P. Schartner, A. Katterfeld, C.A. Wheeler, and C. Wensrich: Coupled DEM and FEM Simulations for the analysis of belt deflection; Bulk Solids Europe, 4th International Conference & Exhibition, Conference Proceedings A6.3, Berlin, 2012.
- Dratt, M., P. Schartner, A. Katterfeld, and C.A. Wheeler: Gekoppelte Simulationen auf Basis der Diskrete und Finite Elemente Methode und deren Anwendungsmöglichkeit in der Schüttgutfördertechnik; Tagungsband 17. Fachtagung Schüttgutfördertechnik, München, 2012.
- Schartner, P., L. Titmarsh, M. Dratt and A. Katterfeld: Gutverhalten im Taschengurtförderer (Pouch Conveyor); Tagungsband 18. Fachtagung Schüttgutfördertechnik, Magdeburg, 2013.
- CEMA: Belt Conveyors for Bulk Materials; 6. Edition (2005),p. 123.
- Dratt, M.: Analyse der Interaktion zwischen Fördergerät und Schüttgut durch gekoppelte Finite und Diskrete Element Simulation. PhD Thesis. Otto-von-Guericke-Universität Magdeburg, 2015 (in press).
| About the Authors | |
 Dr.-Ing. Mathias DrattAfter his graduation as an engineer for mechanical engineering in 2009 at the Otto-von-Guericke-University Magdeburg Mathias Dratt worked for the CeParTec GmbH and since 2011 for the IBAF GmbH. His main focus is the FEM and DEM simulation for bulk material handling equipment. He is also working on his PhD thesis about the coupling of both these simulation methods.IBAF GmbH, Germany Dr.-Ing. Mathias DrattAfter his graduation as an engineer for mechanical engineering in 2009 at the Otto-von-Guericke-University Magdeburg Mathias Dratt worked for the CeParTec GmbH and since 2011 for the IBAF GmbH. His main focus is the FEM and DEM simulation for bulk material handling equipment. He is also working on his PhD thesis about the coupling of both these simulation methods.IBAF GmbH, Germany |
|
 Prof. Dr.-Ing. André KatterfeldProf. Dr.-Ing. André Katterfeld holds the chair of Conveying Technology at the Institute of Logistics and Material Handling Systems of the Otto-von-Guericke-University Magdeburg. After completing his degree in mechanical engineering and his PhD in 2005, he worked as a research assistant in numerous research projects focusing the application of the Discrete Element Method (DEM) in the field of bulk material handling. From 2009 to 2014 he worked as an Associate Professor in Magdeburg before he was appointed Professor for Conveying Technology in 2015. Since 2012 he is also a Conjoint Associate Professor at the University of Newcastle (Australia).TUNRA Bulk Solids Research AssociatesThe University of Newcastle, Australia Prof. Dr.-Ing. André KatterfeldProf. Dr.-Ing. André Katterfeld holds the chair of Conveying Technology at the Institute of Logistics and Material Handling Systems of the Otto-von-Guericke-University Magdeburg. After completing his degree in mechanical engineering and his PhD in 2005, he worked as a research assistant in numerous research projects focusing the application of the Discrete Element Method (DEM) in the field of bulk material handling. From 2009 to 2014 he worked as an Associate Professor in Magdeburg before he was appointed Professor for Conveying Technology in 2015. Since 2012 he is also a Conjoint Associate Professor at the University of Newcastle (Australia).TUNRA Bulk Solids Research AssociatesThe University of Newcastle, Australia |
|
 A/Prof. Craig A. WheelerCraig Wheeler is an Associate Professor in the School of Engineering at the University of Newcastle, Australia and Associate Director of TUNRA Bulk Solids. He worked as a mechanical engineer for BHP Billiton for eleven years and then as a research fellow at the Centre for Bulk Solids and Particulate Technologies for four years. He was appointed as an academic in the Discipline of Mechanical Engineering in 2003 and continues to undertake contract research in the area of belt conveyor design, testing and optimization.TUNRA Bulk Solids Research AssociatesThe University of Newcastle, Australia A/Prof. Craig A. WheelerCraig Wheeler is an Associate Professor in the School of Engineering at the University of Newcastle, Australia and Associate Director of TUNRA Bulk Solids. He worked as a mechanical engineer for BHP Billiton for eleven years and then as a research fellow at the Centre for Bulk Solids and Particulate Technologies for four years. He was appointed as an academic in the Discipline of Mechanical Engineering in 2003 and continues to undertake contract research in the area of belt conveyor design, testing and optimization.TUNRA Bulk Solids Research AssociatesThe University of Newcastle, Australia |
■
