| left | center | right | |
|---|---|---|---|
| Ip [%] | 0.8 | 0.8 | 0.8 |
| tt [%] | 0.5 | 0.6 | 0.5 |
| ε [n/mm] | 12820 | 11905 | 12195 |
The results obtained from the comparative measurement confirmed a primary assumption concerning the modulus of elasticity values. The differences among the modulus of elasticity values, which were measured on three testing specimens extracted from margins and from middle of the comparative sample, are negligible. However, the differences among the modulus of elasticity values measured on the testing specimens separated from the sample of rubber-textile conveyor belt, which was damaged dynamically, are considerable.
Another type of test, which was performed first on the analysed sample of the conveyor belt and afterwards on the comparative sample, was the test of conveyor belt troughability (Table 4).
| Sample A | Sample B | Comparative sample | |
|---|---|---|---|
| Troughability [-] | 0.206 | 0.235 | 0.335 |
The results obtained from the troughability test of the conveyor belt present differences between the analysed and comparative sample of the conveyor belt. However, if there is taken into consideration a fact that the analysed sample was divided into two parts and the comparative part was solid, it is possible to discount these results.
The last set of the performed tests was measuring of adhesive strength among the individual constructional components of the analysed and comparative sample of the conveyor belt. The measured data did not demonstrate any significant contradictions among the compared values obtained from the individual measured samples.
According to the results obtained from the experimental measurements it was elaborated analysis by means of a computational or simulation model using the FEM-procedure based on the Abaqus software tool utilization.
FEM Model of a Dynamically Damaged Conveyor Belt
The experimentally obtained results established a database for the development and application of a computational model in order to realise the FEM-analysis. Geometry of this model is visible in Fig. 4. Realisation of this computational model required application of a pre-processor, which is a basic part of the software Abaqus. Three idler housings with an offset arrangement of the guiding idlers were simulated within the framework of the computational model geometry.
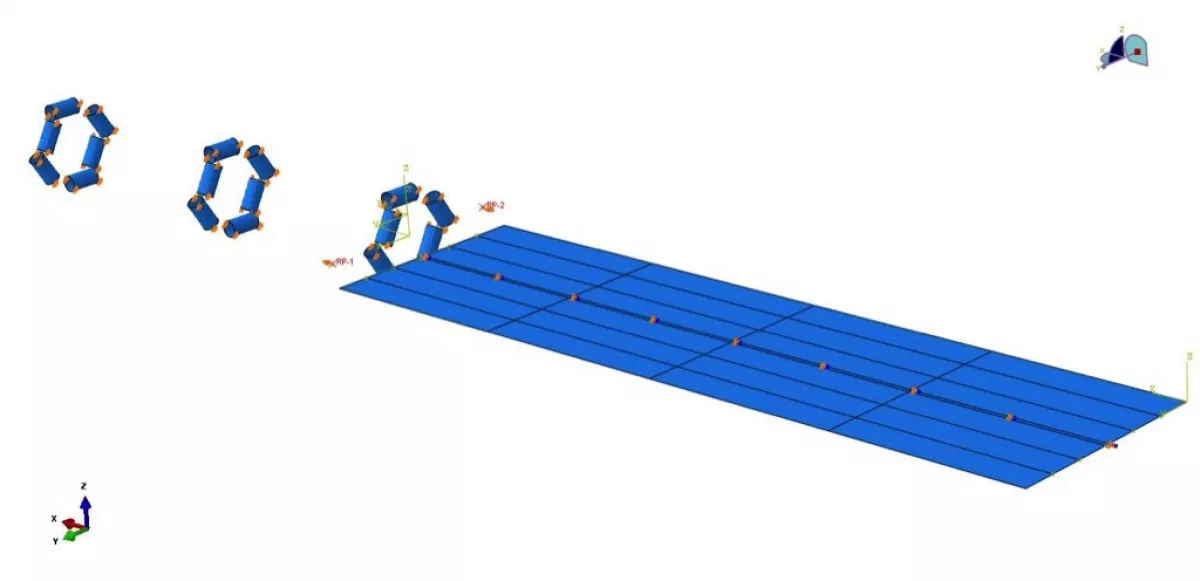
Model of the conveyor belt was divided into the six axial parts taking into consideration the results obtained experimentally from the analysed sample. The six-parts division was selected in order the conveyor belt model could contain six zones with various modulus of elasticity values in accordance with the results obtained from the individual experimental measurements specified for modulus of elasticity determination. The given zones are characterised by the same modulus of elasticity values in transversal direction as well as by the equal material density values, while in longitudinal direction the individual modulus of elasticity values are different in each of zones.
The boundary conditions are defined in such a way that each of the guiding rolls has removed all degrees of freedom. The conveyor belt has removed three degrees of freedom in the middle in all directions except of longitudinal direction. This arrangement enables to do the required shift of the conveyor belt into the correct position in the idler housing within the framework of the calculation process.
Margins of the conveyor belt are bound by means of two referential points and there are situated the auxiliary torques in these referential points in order to form the piped shape of the conveyor belt. Another loading of the conveyor belt represented the gravity force and tensional force. The finite element mesh was assembled using the finite elements of the type Shell with the global contact function defined between the individual contact pairs.
The first part of the computational process was forming of the conveyor belt into the pipe shape by means of the above-mentioned auxiliary torques. Afterwards the pipe-shaped belt was positioned properly into the hexagonal idler housing using the required shifting. Further, the conveyor belt was released after removing of the auxiliary torques so that the belt came into a contact with the forming idlers. Finally, the analysed sample was loaded by the gravity force and tensioning force.
Computational Results
The above-described model was applied for two computational procedures. The first computational process was realised with the different modulus of elasticity values in longitudinal direction in the divided six axial zones. The second computational process used the constant modulus of elasticity values in longitudinal direction in all six zones. All other material constants and boundary conditions remained the same for both computations. The main purpose of this methodology was a comparison of the obtained results in order to discover changes in distribution of the stress-deformation relations in both computational models.
The next figures (Figs. 5, 6) illustrate the calculated distribution of the stress fields in the conveyor belt with a dynamic damage on internal and external side of the pipe conveyor belt in any place of a straight section in conveying trajectory.

Fig. 5. Distribution of the resulting stress fields in the pipe-shaped conveyor belt.
|

Fig. 6. Distribution of the resulting stress fields in axial direction inside of the pipe-shaped conveyor belt.
|

The graphs in Fig. 7 describe the partial values of deformations in the case of pipe-shaped belt in direction of the axes x, y, z. The graphs are recording the values obtained from both computational examples. The graphs show significant differences in the calculated results between the model of conveyor belt, which is damaged dynamically and the model of undamaged conveyor belt. It is possible to say according to the obtained results that if the belt is damaged dynamically, it is formed in the idler housing otherwise than it should be, in comparison with the undamaged belt. The contact points between the belt and forming idlers in the hexagonal idler housing are also different for both types of the conveyor belts.
Conclusion
The results obtained from the experimental measurements and from the FEM computations confirm the primary assumption, which was considered before beginning of the investigative process. The non-standard behaviour of the pipe conveyor belt can be clarified by a divergence of the belt material characteristics and the resulting consequence is a loss of contact between the conveyor belt and guiding rolls in the idler housings as well as flattened shape of the belt. One of the possible undesirable consequences of such situation is a spillage of the transported material along the conveying trajectory. Another operational aspects of the deformed conveyor belt (e.g. motional resistances, wear of belt constructional parts) will be investigated in terms of the next, more detailed research work.
Acknowledgements:
This work is a part of the research projects VEGA 1/0922/12, VEGA 1/0258/14, the project APVV SKCZ-2013-0169 and KEGA 006STU-4/2015.
■