(From the archive of ”bulk solids handling", article published in Vol. 35 (2015) No. 1 , ©2015 bulk-online.com)
1. Introduction Part C
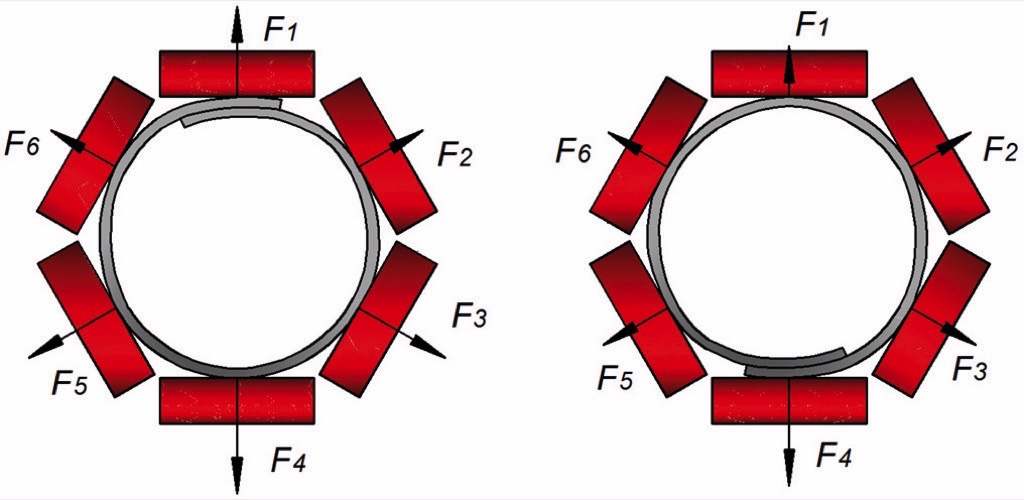
Pipe belt conveyors are recognized as effective continuous transport systems and are widely utilized in various bulk handling industries. Currently, the extensive market for this type of belt conveyors is concentrated primarily in China, India and South Africa. However, according to Zhang and Steven [3], it is reasonable to expect the market to expand into southeast Asia, Australia and South America in the coming few decades. The growing demand for pipe conveyor installations, and the expanding business perspectives promote interest of the belt conveyor manufacturers in research and innovations to improve the efficiency and to ensure reliability of the products they offer.One of the main concerns of the belt conveyor manufacturers is to prevent undesired twisting and buckling of the belt, which can appear during conveyor operation. This problematic behaviour requires additional costs for the installation of special tracking and aligning systems, and demands supplementary time at the conveyor commissioning stage for the necessary adjustments.Another significant trend towards optimal operation is the reduction of the energy consumption and capital costs of pipe belt conveyors. In order to maintain a stable pipe shape and diminish the twisting tendency, the pipe conveyor belt has to exhibit sufficient transverse bending stiffness [4-6]. High transverse rigidity implies excessive indentation rolling resistance [4,7,8], which in turn affects the overall energy consumption of the system and total operational costs required for the project. Imai [6] provides a price comparison between pipe conveyors and conventional trough belt conveyors. He reports that the invested capital costs for a pipe conveyor can exceed the costs of a trough conveyor installation without a rain cover by approximately 50 %, assuming 100 m in length and a capacity of 1000 t/h for both conveyors.As a possible solution, the manufacturers are focused on innovations in belt structure design and material compounds. The change in belt rubber compounds results in a reduction of rubber hysteresis energy loss by applying LRR (Low Rolling Resistance) Technology, discussed by Zhang [4], or the addition of Sulfron aramid product compounds in rubber, as explained by Lodewijks and Pang [9]. In terms of belt structure design, Lodewijks and Pang [9] describe an aramid reinforced carcass belts as an alternative to steel cords usage. For diminishing pipe conveyor twisting tendency, Zhang and Steven [3] introduce another patented steel cord belt structure; the belt described consists of three zones with different embedded steel cord frequency. Modifications in the belt design imply changes in belt properties, which rebound in pipe conveyor operation behaviour.In order to study the properties of the products manufactured and ensure their reliability during conveyor operation, manufacturers have to carry out a number of experimental tests. For this purpose several pipe conveyor test rigs have been designed and assembled. These test rigs vary in their configurations, measurement procedures and results obtained. Since the design of pipe conveyor test rigs is not standardized, it might appear that the test set-up configuration could affect the resultant outcome obtained during measurements. Based on the results received, the manufacturer can come to incorrect conclusions regarding the expected performance of the belt tested. In addition, the relation or similarity between the forces exerted on the pipe belt in the experimental test rigs and the forces exerted on the belt in a belt conveyor is not obvious and gives raise to discussions.The aim of this publication is to provide an overview of the existent pipe conveyor test rig configurations, to conduct an analysis of the inherent design advantages and disadvantages, and also to compare the results obtained. The load distribution measured between the supporting hexagon idler rolls is considered to be an indicator of experimental performance.In order to simplify the comparison, contact forces measured at different test rigs, were adjusted to the certain force numerations and overlap coil orientation. Two cases were implied: overlap on the top and on the bottom (see Figures 2a and 2b, respectively). In addition, each of the contact forces was divided by the sum of the absolute values of all six contact forces (Fn/Σ|Fn|) and was presented in percent. The rate of overlap was presented as a ratio between belt width and pipe diameter B/D. The results were supplemented with information about belt properties, as provided in the source.
2. Dynamic Measurements
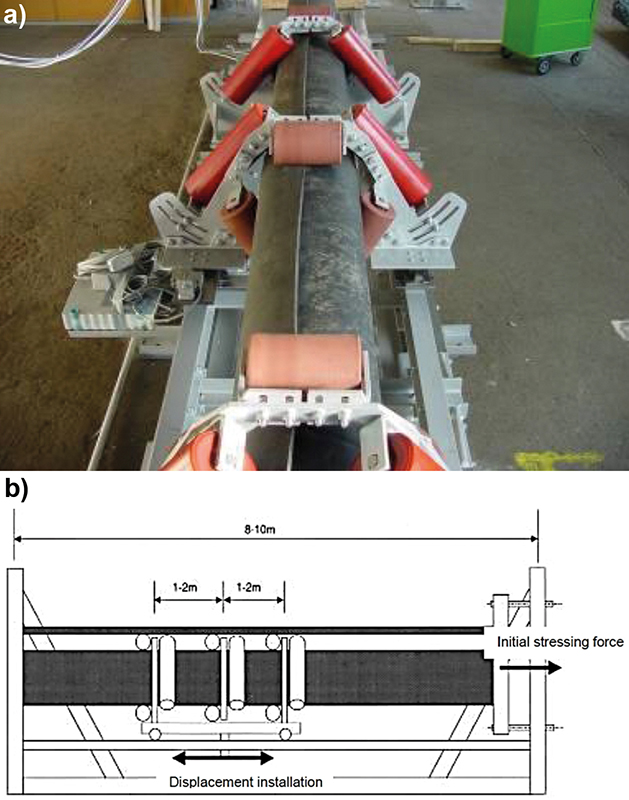
The main advantage of dynamic measurements is that they can provide the most sophisticated information regarding belt behaviour during conveyor operation. They also exclude “solidification” effect in the belt that can appear due to the viscoelastic relaxation in its rubber compounds. This is a characteristic especially inherent to the static test rigs, when the belt is kept in the shape of the pipe for a substantial amount of time. Moreover, together with all possible effects that appear at various belt speeds, dynamic measurements can also reflect twisting and buckling tendencies of the belt at route curves and also the belt’s mechanical response to the tension forces applied. In addition, dynamic tests can contribute to studying the influence of the bulk material transported and its properties on load distribution between the idler rolls. The other static test rig configurations described are not as successful in this regard.Dynamic tests can be obtained through the use of dynamic test rigs, or by performing field measurements. It is reasonable to expect that the dynamic test set-up modelling a pipe conveyor section of actual size with reduced length, must necessarily be very voluminous and excessively expensive. As such, there is not much published information available regarding the dynamic results obtained.One of the simplest dynamic test rigs was described by Kessler [10], and Hinterholzer et al. [11].That test rig was installed at the University of Leoben, Department of Conveying Technology and Design Methods, Austria. It modelled a pipe conveyor with a new belt guidance, where the belt on the return strand was transported on top of the pipe-shaped belt. The purpose of the measurement was to ascertain rolling resistance at the moving rolls, so no information was provided regarding the contact forces at the idler rolls. However, it is important to note the option of modelling dynamics, which was used within that test rig configuration. The test set-up described was designed to be static with a fixed belt at both edges with the required tensile load applied. The dynamic function was carried out by the movable unit with three idler stations (see Fig. 3). Measurements were performed at the central idler station at the unit, with pitch varied between 1 and 2 m. The trolley was accelerated gradually by the rack-and-pinion gear until the required speed was achieved. After that it was kept moving steadily almost along the entire rig length, and was slowly stopped at the test rig edge.
Some dynamic results were obtained by Wiedenroth [12] at the Institute for Materials-Handling Technology and Mining Machinery of the University of Hannover in 1995, by means of the unique dynamic pipe conveyor test rig.That test rig imitated the actual pipe conveyor with reduced length.It consisted of four sections: a 1.6 m long fixation section with a take-up system and hydraulic cylinder; a 6 m transition zone, forming the belt from a flat shape into a pipe; a 12 m central region with hexagon six-roll idler stations, and a 7 m transition discharging zone with driven pulley and the motor station.The idler stations were designed with double side roll arrangements. The measurements were performed at the central idler station, where the belt was fully formed into the pipe shape, by detecting the radial and longitudinal contact forces at each of the idler rolls.
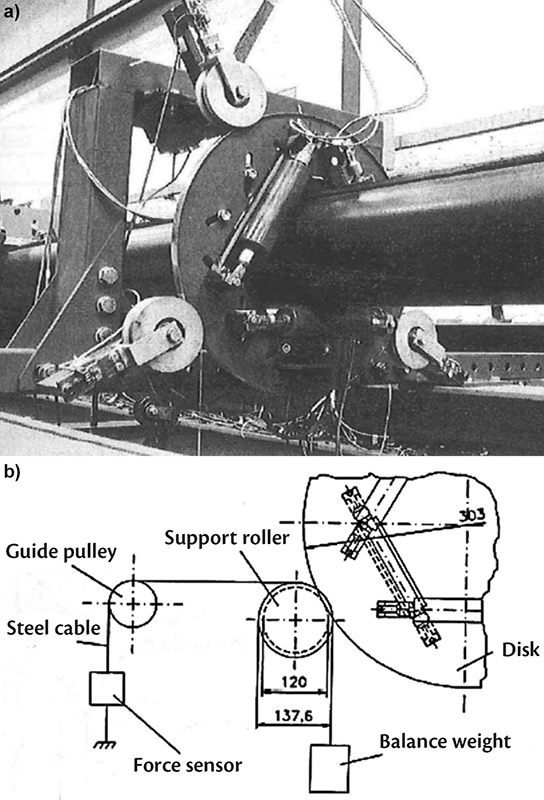
For control, the vector sum of all the normal forces at the six rolls and the total longitudinal force had to match the overall loads at the idler station, measured simultaneously by independent sensing equipment. In order to make this possible, the central idler station was designed with three small supporting rolls (shown in Fig. 4a), these were equipped with sensors that measured loads in longitudinal and radial directions. In addition, each of the bottom rolls had grooves with a wound up thin steel cable. One side of the cable was fixed with the balance weight, and the another side was attached to the guide pulley and the force sensor (see Fig. 4b). This steel cable arrangement was needed to measure twisting torque in the belt, subject to the route’s curves.The route curves were simulated in the horizontal plane by adjusting the position of the idler stations with respect to their supporting frames, situated in the central zone of the conveyor (see Fig. 5). In between the frames of the transition and central zone, angular connecting elements were inserted for aligning the modelling route.
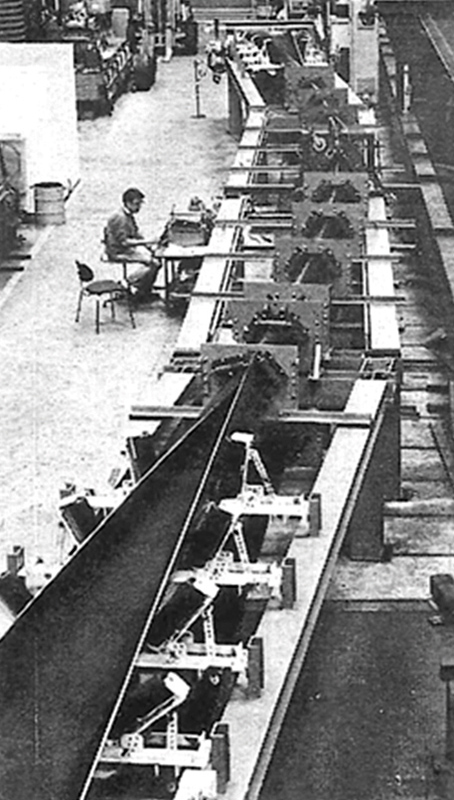
The transition test rig zones with pulleys, motor and take-up system were lifted by the overhead crane, and placed at the required angle from both sides. This test rig configuration enabled the researcher to vary curve radii, conveyor speed, idler spacing, belt tension, and pipe diameter in a range, as presented in Table 1.For the experiment, five pipe conveyor belts with different construction were used (named as A, B, C, D and E). These belts originated from different manufacturers. Belt A had a steel cord structure; belt B, C and D – were fabric belts, and belt E was a steel cord belt with fabric layers.The properties of the belts can be found in Table 2. Before performing measurements, each brand-new belt was placed in the test rig with conveyor pitch of 1 m and run at high speed for 24 hours (at least 200 full belt revolutions) with stepwise variation of the belt tension, starting from 20 kN. Subsequently, the resultant belt elongation was adjusted by the take-up system, and measurements were obtained.
| Pitch[m] | Tension[kN] | Belt speed[m/s] | Curve radii[m] |
| 1; 1.5; 2; 3; 4 | 20; 30; 40; 60; 80 | 0.5; 1; 1.5; 2 | 25; 35; 50; 60; 75; ∞ |
| Belt type | Belt width[mm] | B/D[-] | Troughability | Line mass[kg] | |
| A | St 560 | 730 | 3.47 | 0.323 | 11.1 |
| B | EP 500 | 800 | 3.48 | 0.319 | 10.3 |
| C | EP 630 | 800 | 3.48 | 0.274 | 9.4 |
| D | EP 500 | 770 | 3.67 | 0.239 | 9.6 |
| E | St 1000 | 100 | 3.58 | 0.344 | 20.8 |
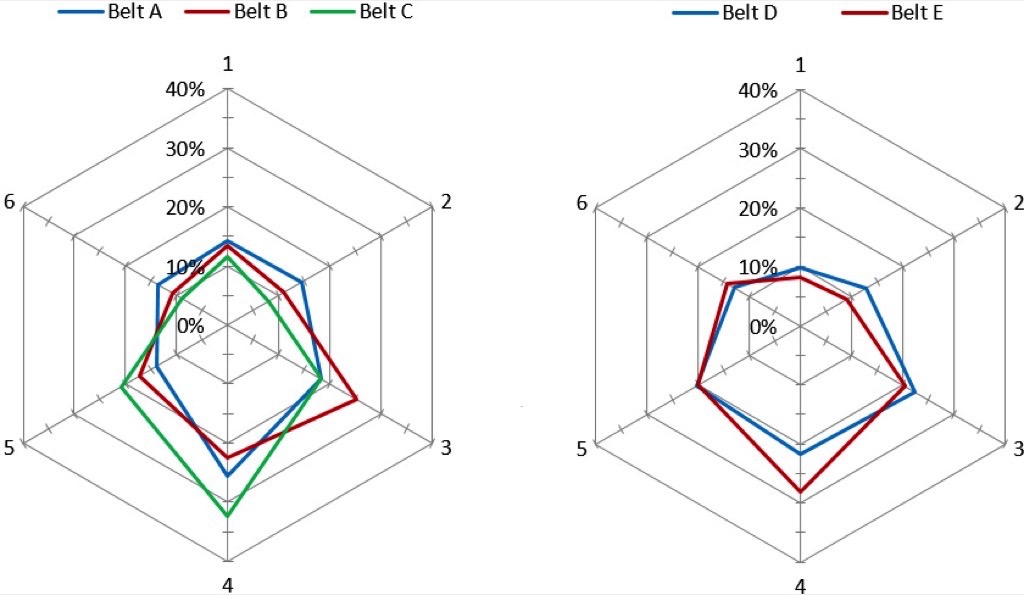
The researchers reported that the total vector sum of the radial contact forces was affected by the variation in belt speed, idler spacing and belt tension. They also stated that those parameters did not influence the load distribution between the idler rolls in relative values with respect to the total sum of the contact forces. Wiedenroth [12] provided results of the contact forces measured, in relative values, for all belt types at belt speed 2 m/s. Figs. 6a and 6b were created based on that data.
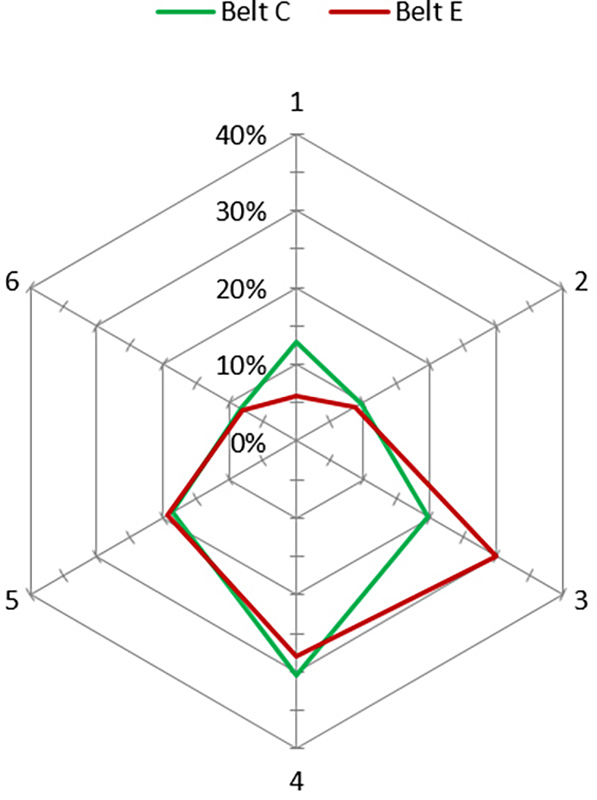
The results mentioned were not supported by any information regarding the corresponding pitch and belt tension, standard deviation of the measurements, or whether those values were averaged for all ranges of belt tensions and carry spacing tested. Fig. 7 represents the load distribution between the idler rolls for the empty pipe conveyor straight sections for belts C and E, which were also available in the source in absolute values [12]. It is important to note that after calculating the relative values, the results for belt C, shown in Figs. 6 and 7, do not deviate significantly. However, for the steel cord belt E the difference in load distribution, obtained at belt speeds of 2 m/s and 0.25 m/s (Figs. 6 and 7), is more obvious.
Comparison of the results between fabric belt samples B and C, which had the same belt width and rate of overlap, showed that belt construction C had more loaded bottom rolls with respect to top rolls than belt design B; this was even though belt B was more flexible and slightly heavier. The opposite tendency could be observed for steel cord belt E, which was also heavier and rather flexible than steel cord belt A. A higher load quotient in lateral rolls was detected for the fabric belt structure D, compared to the fabric belt C with similar line mass. This was due to the fact that belt D was stiffer and had larger overlap than construction C. It is important to emphasize that those observations with respect to belt construction could be considered only from a qualitative point of view, as pipe conveyor belts exhibit uneven line mass and uniform transverse stiffness along their width, deviating for belts from different manufacturers.Other dynamic results available were obtained via field measurements. Those measurements were performed by Bahke [13] at a “Rollgurt”-Conveyor in the lime and cement plant Alsen Breitenburg in Germany. That pipe conveyor had a straight as well as an S-curve section in its route. The aim of the tests was to measure power and torque occurring at the drive system, as well as radial and longitudinal contact forces for individual idler rolls and for overall tested idler stations. The measurements were performed at four different route locations for belt width 730 mm and ratio B/D = 3.65. No information was provided regarding other belt properties and their construction.
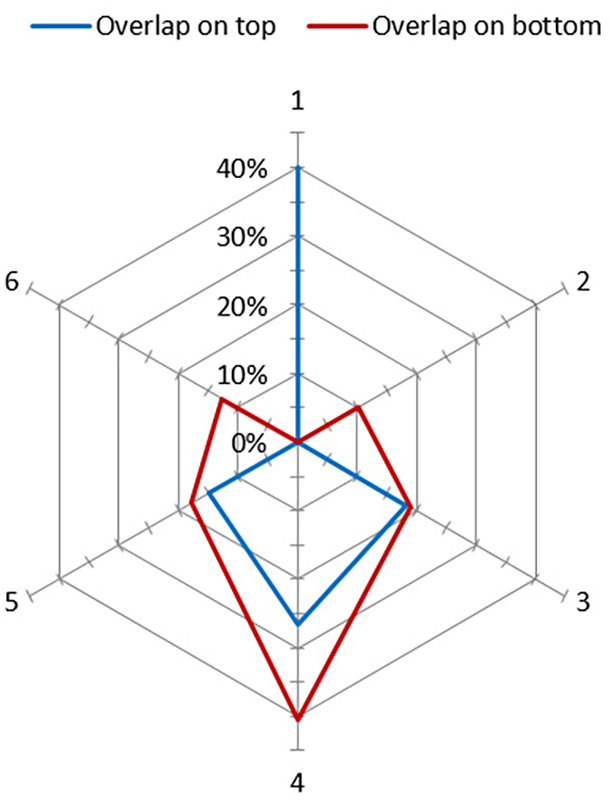
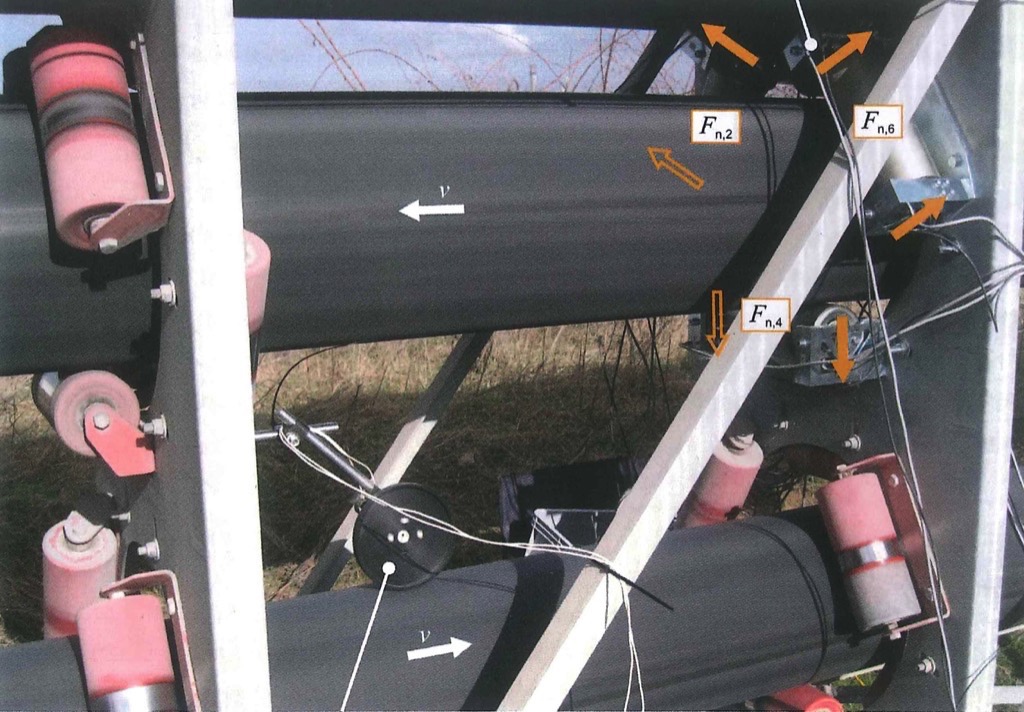
For comparison, average results were selected that represent straight sections of empty belt with overlap on the top and bottom with carry spacing of 1.5 m. Those results were adjusted according to Figs. 2a and 2b and are illustrated in Fig. 8.Field measurements were carried out by Hötte [14], Institute of Transport and Automation Technology (ITA) at Leibniz University of Hannover. The experiment was performed at the pipe conveyor in cement plant Hugo Miebach Söhne, Portland-Zementwerk Wittekind. This conveyor was installed with the idler stations with the double side rolls arrangement. It had inclined straight route sections as well as sections with horizontal and vertical curves.For the measurements, four positions of the idler stations along the conveyor route were selected. At these locations, the idler rolls were dismounted from the panels and replaced with units, equipped with the measuring system of twelve load sensors. The position of the rolls at the measuring idler panel was aligned using cords over two idler panels in front and two idler panels behind. Over all of these five panels, all idlers were adjusted accordingly. For each idler roll, two calibrated force transducers were placed in the brackets at both sides of the roll shaft. Therefore, the sum of data obtained by the two sensors represented the total contact force for the corresponding idler roll (see Fig. 9). The belt speed was controlled during the experiment by a measuring rotary wheel encoder.
For the results comparison, this paper presents only contact forces, obtained at the idler station in straight route section. The selected conveyor section had a slight inclination of -0.4°, though the impact of it on contact forces is considered rather insignificant. Moreover, Hötte [14] in his study pointed out that at this location the cross section of pipe conveyor belt had an oval shape geometry. The available details on pipe conveyor parameters at this route section are given in Table 3.
| Belt type | Belt segment type | Exploitation time of belt segment[years] | Belt width[mm] | B/D[-] | Pitch[m] | Measured belt speed[m/s] |
| EP 1250 | a | 11 | 1350 | 3.86 | 2.4 | 3 |
| b | 5 | |||||
| c | 3 |
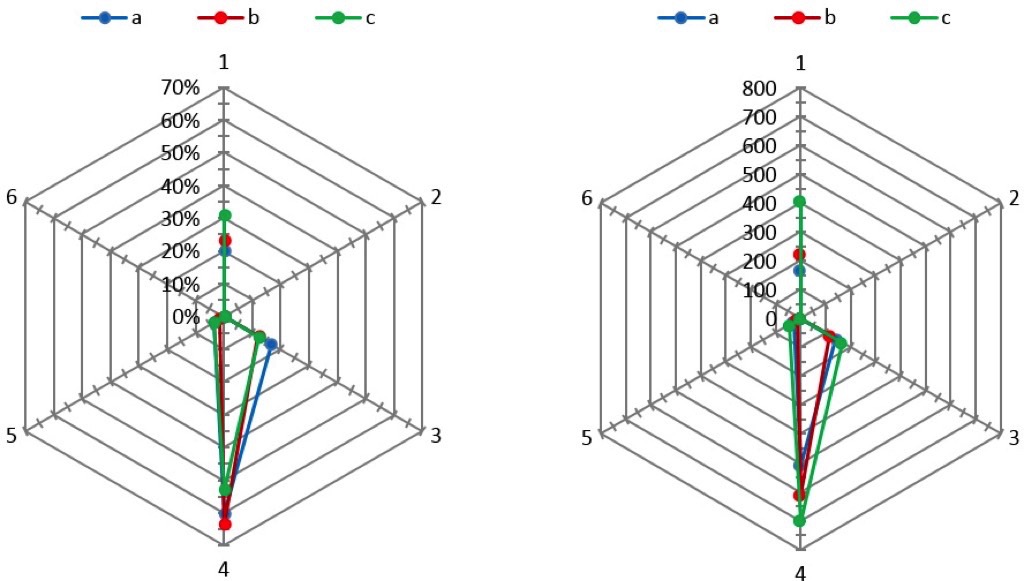
The experiment was performed when the pipe conveyor operated without bulk material. That is why the results were affected only by the belt tension, conveyor route and belt properties, some of which are given in Table 3. The conveyor belt consisted of the segments that had the same belt type, nomenclature and structural design, but differed in their exploitation time. Those belt segments were denoted as (a, b and c) in the study.The results were detected and stored for approximately 2 hours for each position with a sample rate of 10 Hz. Fluctuating lines represent each of the contact forces of the measuring idler station over the experiment time. Hötte [14] made an interesting observation that the force lines had repeatable patterns in the results. The patterns appear in accordance to the belt segment type (a, b, or c), which were running through the idler station at the moment of the measurement.Hötte [14] averaged fluctuating results of contact forces over the certain value for each of the belt segment type independently. In general, the belt segment type (b) showed higher contact forces in absolute values than the segment type (c) and smaller contact forces than the segment type (a). The researcher showed that the exploitation time of the belt significantly affects the contact forces detected. Particularly, the longer the belt is in use, the smaller contact forces it generates in absolute values.The effect of the belt exploitation time on the contact forces can be explained by the viscoelasticity and the Mullin effect in the conveyor belt’s behaviour. The periodic loading and deformation of the belt during an extensive amount of time affects its stress-strain characteristics. The latter identifies the belt’s bending stiffness. For the particular case a long exploitation time of the belt leads to a decrease of the effective modulus of elasticity.In the present paper, the results of the contact forces for different belt segment types are replicated in Fig. 10 in absolute values and in relative scale. The results show a similar pattern, as the contact force diagram, obtained by Bahke [13] for an empty pipe conveyor with the overlap on the top. The load distributions between the idler rolls from the both sources [13, 14] exhibit a significant force on the top roll 1, contact loss with the lateral top rolls 2 and 6, and a higher contact force at roll 3 with respect to roll 5.
Summing up, it is possible to state that in general, dynamic test rigs or field measurements have their own benefits and drawbacks, compared to static test rig configurations. They are beneficial in studying dynamic effects during a conveyor’s operation, and are suitable for testing the influence of the bulk materials conveyed. A main drawback, though, is the large volume and high costs of the test rig installation.In case of field measurements, results are limited to the case variations tested. They are also restricted to the particular belt, pipe diameter, pitch, route, etc. of the installation. As a result, the field measurements occur after opportunities for optimization and change in the belt conveyor design used. They are not helpful for corrections in particular installations, but could be used only for the future conveyor developments. Additionally, the field experiment are affected by performance restrictions due to the requirements of production line in mine or plant, were the measurement are performed. The negative and positive aspects inherent to dynamic measurements are listed in Table 4.
| Advantages | Disadvantages |
|
|
3. Summary and Conclusions: Parts A, B and C
This paper is the final part of a series of publications focused on the analysis of the existent pipe conveyor test rigs with various design configurations, their design advantages and disadvantages, and comparison of the load distribution obtained between idler rolls in terms of the contacts forces measured. The publication was divided into three parts (Parts A, B and C), based on the test-rig formations.The simplest configuration mentioned was the so-called six-point stiffness testing device, which became the main focus of Part A. The test set-ups of that kind are relatively inexpensive, and simple in installation and performance. Though, they are not suitable for studying 3D belt behaviour, like tendency of twisting and buckling of pipe conveyor belt. For this purpose static test rigs with special frames and supports were assembled.The drawbacks of the test set-ups mentioned were their space-intensive and expensive designs, as well as problematic and time consuming procedures for belt replacement and adjustments. Moreover, they were not capable of modelling dynamic effects and bulk material behaviour, similar to actual conveyors. Additionally, the static fixation of the viscoelastic belt for substantial time could affect test results due to the relaxation of the belt’s rubber compounds.In order to take this into account, dynamic tests, including field measurements, were performed. These tests were discussed above in Part C. Typically dynamic test rigs are more expensive and massive compared to the static prototypes with frames, whereas field measurements are always too late to drive improvements in belt design and selection of conveyor parameters. Choices about test set-up design should always take into account the possibility of variation in test cases, like changes of pipe diameter, pitch, speed, tension, idlers configuration, and so on.With regard to the contact forces, which were considered as an indicator of test rig performance, it was found that for the case with overlap on the top, the loads at individual rolls were around 40% of the sum of all contact forces (except for the results of the dynamic test made by Hötte, which yield up till 70%). For the overlap at the bottom, these forces did not exceed 80% of the sum. In general the contact force at the top roll was quite significant, compare to the other rolls. In addition, for the case with overlap on top, following the belt coil, lateral roll 2 (see reference Fig. 2a) was in a more loaded position, and the following lateral roll 3 was in the less loaded position.Furthermore, the results, obtained from different test rigs, varied quite significantly. However, some similarities in obtained results of the contact forces were found. For the case with the overlap on the top, the most repeatable patterns represented following diagrams:
- all the rolls were in contact with the belt, and forces at the bottom rolls 1, 2 and 3 were higher (Zamiralova and Lodewijks [1], Wiedenroth [12], Xiaoxia et al. [15]);
- contact loss appears at one of the top lateral rolls, most frequently for the roll 2 at the beginning of the belt coil, considering reference Fig. 2 (Zamiralova and Lodewijks[1], Hötte et al. [5], Hötte [14]);
- both top lateral rolls 2 and 6 had a contact loss, while the force at top roll 1 was significant (Zamiralova and Lodewijks[1], Bahke [13], Hötte [14]).
For the overlap on the bottom, the most frequent load diagram showed a dramatic load increase at the bottom roll, with minor contact forces at the lateral rolls (see Zamiralova and Lodewijks [1], Pang and Lodewijks [16], Bahke [13]).Pipe conveyor contact forces are the major indicator of the conveyor belt behaviour during the system operation. Based on the experimental results, obtained from the pipe conveyor test rigs, the manufacturers can make a decision about the reliability of the belt performance in certain conveyor operation conditions. Ultimately, the belt’s mechanical response to loads, tested under an incorrect test rig design or with an irrelevant test procedure, could mislead the manufacturers. Consequently, it can causea number of operational problems in the conveyor behaviour, such as large belt twisting, buckling and collapsing, the opening between the idler stations at the overlap, or even problems with starting the conveyor.This paper demonstrates that the results, obtained at different test rig configurations, generally deviate with some repetition in load diagrams. This draws attention to the necessity of developing a uniform standard regarding proper pipe conveyor test rig configuration. In general pipe conveyor contact forces are governed by the belt properties (bending stiffness, line mass, geometry, structure design, etc.) and also conveyor systems parameters (pipe diameter, carry spacing, belt speed, tension, etc.) That is why the required test rig design should provide a broad range of options for the tested case variation. Consequently, the standard should also be supplemented with an appropriate test performance procedure.
Acknowledgement:
The authors would like to express their gratitude to Phoenix Conveyor Belt Systems GmbH, particularly Dr.-Ing. Tobias Wennekamp and Dr.-Ing. Stephan Hötte for their contribution and support in the performance of experiments for Delft University of Technology, Section of Transport Engineering and Logistics on static six-point belt stiffness device, reflected in Part A of this publication. The authors are also grateful to Fenner Dunlop Conveyor Belting, particularly Mr. Sytze Brouwers and Mr. Jeroen Kattouw for providing a sample of a certain belt type for the mentioned experiments.
References:
- Zamiralova, M.E., and G. Lodewijks: Pipe conveyor test rigs: Design, application and test results - Part A; Bulk Solids Handling, 34 (2014) No. 5, pp. 40-45.
- Zamiralova, M.E., and G. Lodewijks: Pipe conveyor test rigs: Design, application and test results - Part B; Bulk Solids Handling, 34 (2014) No. 6, pp. 38-46.
- Zhang, Y., and R. Steven: Pipe conveyor and belt: Belt construction, low rolling resistance and dynamic analysis; Society of Mining, Metallurgy and Exploration 2012 Annual Meeting, Seattle (WA), 2012, pp. 616-619.
- Zhang, Y.: Extended reach: Overland pipe conveyor with low rolling resistance belt; Bulk Solids Handling, 33 (2013) No. 4 pp. 16-21.
- Hötte, S, L. Overmeyer and T. Wennekamp: Form force behaviour of pipe conveyors in different curve radii; Bulk Solids Handling, 31 (2011) pp. 164-169.
- Imai, A.: Pipe Conveyor Development, Benchmark and Future Trend; Whitepaper, www.bulk-solids-handling.com, (2012) pp. 1-9.
- Zamiralova, M.E., and G. Lodewijks: Energy consumption of pipe belt conveyors: Indentation rolling resistance; FME Transactions, 40 (2012) 171-176.
- Zamiralova, M.E., K.M.B. Jansen, and G. Lodewijks: Indentation rolling resistance of pipe belt conveyors using three-dimensional generalized Maxwell viscoelastic model; 11th International Congress on Bulk Materials Storage, Handling and Transportation (ICBMH 2013), The University of Newcastle, Australia, 2-4 July, 2013.
- Lodewijks, G., and Y. Pang: Energy saving options for continuous transport systems, an exploration; 11th International Congress on Bulk Materials Storage, Handling and Transportation (ICBMH 2013), The University of Newcastle, Australia, 2-4 July, 2013.
- Kessler, F.: Pipe conveyor with a completely new belt guidance; BELTCON 12: International Materials Handling Conference (IMHC), South Africa, Johannesburg, 23-24 July, 2003, http://www.beltcon.org.za/docs/b1210.pdf.
- Hinterholzer, S., F. Kessler, and K. Grabner: Belt Conveyor Technology - Research on a Pipe Conveyor with a Completely New Belt Guidance; Bulk Solids Handling, 21 (2001), No. 6. pp. 614 ff.
- Wiedenroth, J.: Untersuchungen zum Betriebsverhalten unbeladener Schlauchgurtförderer; PhD Thesis, Universität Hannover, 1995.
- Bahke, T.: Calculation criteria and application of “Rollgurt” - conveyor (tube conveyor), BELTCON 6: International Materials Handling Conference (IMHC), South Africa, Johannesburg, 17-19 September, 1991, http://www.saimh.co.za/beltcon/beltcon6/paper64.html.
- Hötte, S.: Experimentelle Untersuchungen zu den Normalkräften bei Schlauchgurten; PhD Thesis, Institut für Transport- und Automatisierungstechnik (ITA) der Leibniz Universtät Hannover TEWISS-Technik und Wissen GmbH, Garbsen, Germany, 2014.
- Xiaoxia, S., M. Wenjun, Z. Hui, Y. Yuan, and Y. Zhengmao: Analysis on the bending stiffness and the form force of the pipe conveyor belt; Sensors and Transducers, 161 (2013), pp. 655-660.
- Pang, Y., and G. Lodewijks: Pipe belt conveyor statics - Comparison of simulation results and measurements; Bulk Solids Handling, 33 (2013), No. 2, pp. 52-56.
| About the Authors | |
 MSc. Maria E. ZamiralovaMSc. Maria E. Zamiralova obtained her Specialist Degree of Science cum laude from Dept. of Mining Mechanics and Transport at Moscow State Mining Univ., Russia, in June 2011 with a thesis about the construction design and development of improved tension calculation procedure for spatially curved telescopic pipe belt conveyor. Currently, she is a PhD researcher at Delft University of Technology on project “Optimal design of pipe belt conveyors” started in September 2011. Her main interests are in bulk handling equipment, belt conveyor technology, pipe conveyor design, optimization and standardization.Dept. of Transport Engineering and LogisticsDelft University of Technology, The Netherlands MSc. Maria E. ZamiralovaMSc. Maria E. Zamiralova obtained her Specialist Degree of Science cum laude from Dept. of Mining Mechanics and Transport at Moscow State Mining Univ., Russia, in June 2011 with a thesis about the construction design and development of improved tension calculation procedure for spatially curved telescopic pipe belt conveyor. Currently, she is a PhD researcher at Delft University of Technology on project “Optimal design of pipe belt conveyors” started in September 2011. Her main interests are in bulk handling equipment, belt conveyor technology, pipe conveyor design, optimization and standardization.Dept. of Transport Engineering and LogisticsDelft University of Technology, The Netherlands |
|
 Prof. dr. ir. Gabriel LodewijksProf. Gabriel Lodewijks studied Mechanical Engineering at Twente University and Delft University of Technology, The Netherlands. He obtained a Master degree in 1992 and a PhD on the dynamics of belt systems in 1996. He is President of Conveyor Experts BV, which he established in 1999. In 2000 he was appointed professor of the department Transport Engineering and Logistics at the Faculty of Mechanical, Maritime and Materials Engineering. From 2002 he was appointed as chairman of the department. His main interest is in belt conveyor technology, automation of transport systems, material engineering and dynamics.Dept. of Transport Engineering and LogisticsDelft University of Technology, The Netherlands Prof. dr. ir. Gabriel LodewijksProf. Gabriel Lodewijks studied Mechanical Engineering at Twente University and Delft University of Technology, The Netherlands. He obtained a Master degree in 1992 and a PhD on the dynamics of belt systems in 1996. He is President of Conveyor Experts BV, which he established in 1999. In 2000 he was appointed professor of the department Transport Engineering and Logistics at the Faculty of Mechanical, Maritime and Materials Engineering. From 2002 he was appointed as chairman of the department. His main interest is in belt conveyor technology, automation of transport systems, material engineering and dynamics.Dept. of Transport Engineering and LogisticsDelft University of Technology, The Netherlands |
■