








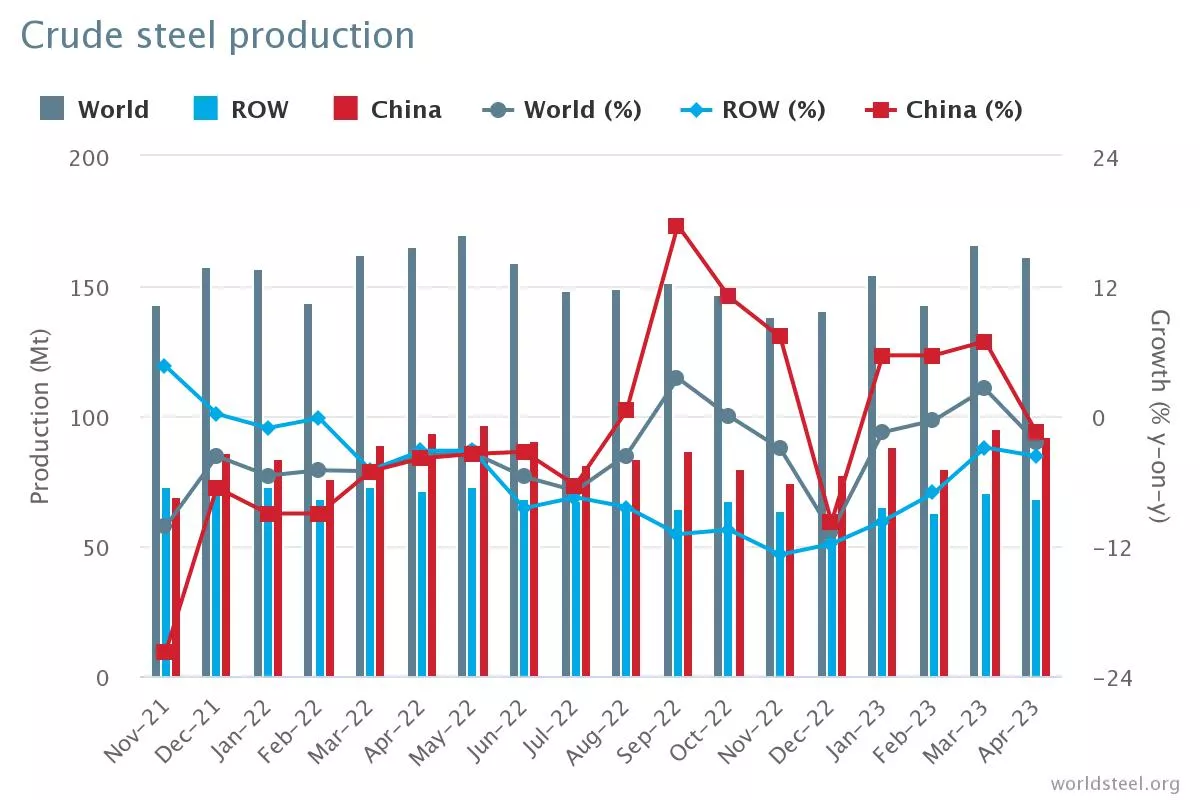
Crude Steel Production by Region
Africa produced 1.3 Mt in April 2023, up 4.8% on April 2023. Asia and Oceania produced 121.1 Mt, down 1.5%. The EU (27) produced 11.1 Mt, down 11.7%. Europe, Other produced 3.5 Mt, down 17.3%. The Middle East produced 4.2 Mt, up 4.2%. North America produced 9.2 Mt, down 4.6%. Russia & other CIS + Ukraine produced 7.5 Mt, up 5.9%. South America produced 3.6 Mt, down 2.2%.
The 63 countries included in Table 1 accounted for approximately 97% of total world crude steel production in 2022. Regions and countries covered by the table:
- Africa: Egypt, Libya, South Africa, Tunisia
- Asia and Oceania: Australia, China, India, Japan, Mongolia, New Zealand, Pakistan, South
- Korea, Taiwan (China), Viet Nam
- European Union (27): Austria, Belgium, Bulgaria, Croatia, Czechia, Finland, France,
- Germany, Greece, Hungary, Italy, Luxembourg, Netherlands, Poland, Portugal, Romania,
- Slovakia, Slovenia, Spain, Sweden
- Europe, Other: Macedonia, Norway, Serbia, Türkiye, United Kingdom
- Middle East: Iran, Qatar, Saudi Arabia, United Arab Emirates
- North America: Canada, Cuba, El Salvador, Guatemala, Mexico, United States
- Russia & other CIS + Ukraine: Belarus, Kazakhstan, Russia, Ukraine
- South America: Argentina, Brazil, Chile, Colombia, Ecuador, Paraguay, Peru, Uruguay,
- Venezuela
| Apr. 2023 (Mt) | % change Apr. 23/22 | Jan.-Apr. 2023 (Mt) | % change Jan.-Apr. 23/22 | |
|---|---|---|---|---|
| Africa | 1.3 | 4.8 | 5.0 | -0.8 |
| Asia and Oceania | 121.1 | -1.5 | 467.5 | 2.3 |
| EU (27) | 11.1 | -11.7 | 44.4 | -10.2 |
| Europe, Other | 3.5 | -17.3 | 12.9 | -18.8. |
| Middle East | 4.2 | 4.2 | 14.3 | 1.9 |
| North America | 9.2 | -4.6 | 36.2 | -3.8 |
| Russia & other CIS + Ukraine | 7.5 | 5.9 | 238.9 | -7.9 |
| South America | 3.6 | -2.2 | 13.6 | -5.6 |
| Total 63 countries | 161.4 | -2.4 | 622.7 | -0.3 |
Top 10 Steel Producing Countries
China produced 92.6 Mt in April 2023, down 1.5% on April 2022. India produced 10.7 Mt, up 3.2%. Japan produced 7.2 Mt, down 3.1%. The United States produced 6.6 Mt, down 5.3%. Russia is estimated to have produced 6.4 Mt, up 1.9%. South Korea produced 5.7 Mt, up 3.0%. Germany produced 3.2 Mt, down 3.8%. Brazil produced 2.8 Mt, down 5.9%. Türkiye produced 2.7 Mt, down 20.6%. Iran produced 3.1 Mt, up 5.9%.
| Apr. 2023 (Mt) | % change Apr. 23/22 | Jan.-Apr. 2023 (Mt) | % change Jan.-Apr. 23/22 | |
|---|---|---|---|---|
| China | 92.6 | -1.5 | 354.4 | 4.1 |
| India | 10.7 | 3.2 | 43.9 | 3.0 |
| Japan | 7.2 | -3.1 | 28.9 | -5.3 |
| United States | 6.6 | -5.3 | 26.1 | -4.1 |
| Russia | 6.4e | 1.9 | 25.1 | -0.6 |
| South Korea | 5.7 | 3.0 | 22.4 | -0.4 |
| Germany | 3.2 | -3.8 | 12.4 | -5.9 |
| Brazil | 2.8 | -5.9 | 10.6 | -8.8 |
| Türkiye | 2.7 | -20.6 | 10.1 | -21.3 |
| Iran | 3.1 | 5.9 | 9.7 | 0.1 |
e estimated. Ranking of top 10 producing countries is based on year-to-date aggregate.
■