

To Krige Or Not To Krige?
Hi Geostatnube,
Here’s what you ought to know about geostat before plunging into plumes! A set of two or more measured values, determined in samples selected at positions with different coordinates in a sample space, gives not only an infinite set of distance-weighted averages but also a correspondingly infinite set of variances. A pioneering plotter found the infinite set of distance-weighted averages but lost its matching set of variances. Regrettably, none of the nascent geostatistical scholars noticed that the infinite set of variances was lost. This problem was solved by converting the distance-weighted average into a kriged estimate, and replacing the variance of a SINGLE kriged estimate with the pseudo variance of a SUBSET of an infinite set of kriged estimates.
So the practice of geostats is based on selecting the least biased subset of the infinite set of kriged estimates, and smoothing its pseudo kriging variance to perfection. All it takes is to assume spatial dependence, interpolate by kriging, smooth to perfection and rig the rules of mathematical statistics!
Mathematical statistics teaches that verifying spatial dependence ought to precede interpolation by kriging, and that each and every kriged estimate-earlier-know-as-distance-weighted average has its own variance. Work with measured data and get sampling variograms and sound statistics. Work with kriged data and get semi-variograms and smoothed plumes.
Why do you want to interpolate if you do have ‘ultra high density data’? What do you measure? What does your plume consist of? Do you want software that allows sound statistical inferences or that gives gorgeous 3-D graphs? If you want to import large data sets into your own software, you should look at Eclipse Modeling Framework.
Kind regards,
Jan W Merks ■
Re: Kriging & Geostatistics For Plume Delineation
I guess this would be a good representation of what I do.

Data is ultra dense in the Z direction. Not in the X and Y directions.
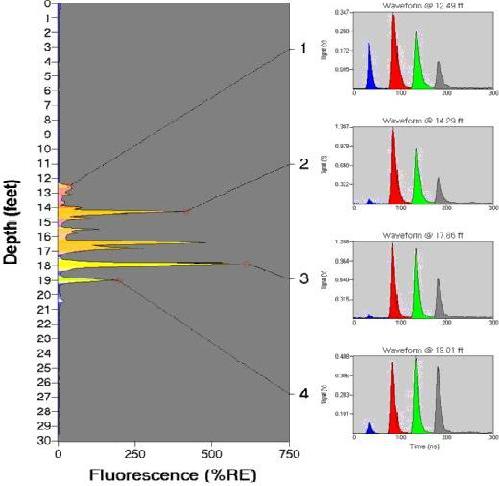
I attached a log to give a representation of what I am dealing with. ■
Re: Kriging & Geostatistics For Plume Delineation
A Glance At Data Sets
Your data sets display widely different probability distributions. Sets 1 and 2 are multimodal whereas Sets 3 and 4 appear normally distributed. The central value of each set is not necessarily its arithmetic mean. The central values do differ significantly. The variances of Sets 1, 2 and 3 give a high degree of precision for their central values.
Why do you want to assume spatial dependence, interpolate by kriging, smooth the pseudo variance of a subset of kriged estimates, rig the rules of mathematical statistics, and risk your reputation as a statistically astute scientist? If your data are measured in a plume from a stack, you could test for spatial dependence between temporally spaced data.
JWMerks ■
Re: Kriging & Geostatistics For Plume Delineation
I am not very familiar with statistics, so please forgive ignorance, but just want some thoughts from you regarding kriging since I have used it for some deterministic modelling:
What is wrong with modelling the covariance by distance thereby assuming spatial dependence? Are the main concerns:
* The concept of degrees of freedom does not apply?
* Do not account for the variances produced from all distance averages?
And what went wrong at Bre-X? Was it that the salting was not picked up by the kriging because of the loss of these concepts and interpolated throughout the sampling domain?
Does it mean that when applying kriging to physical situations care needs to be taken to ensure the authenticity of the samples? Then kriging should be OK? Or are the underlying differences with statistics the key concern?
I am just taking this opportunity to query about this controversial topic. Thank you for the discussion.
BLUE ■
To Krige Or Not To Krige?
That's not a question in real statistics! The problem in surreal geostatistics is that Agterberg's distance-weighted average lost its variance first in 1970 and again in 1974. As few as a pair of measured values, determined in samples selected at positions with different coordinates in a finite sample space, gives an infinite set of honorific kriged estimates. Now that's a lot of free-roaming kriged estimates in a finite sample space. Of course, the probability to select the least biased subset of some infinite set is infinitisemal small. And it takes quite a while. JanWMerks! ■
Real Statistics Or Surreal Geostatistics?
All you need to know is that Dr F P Agterberg fumbled the variance of his distance-weighted average point grade in 1970 and in 1974. Assuming spatial dependence makes no sense in real statistics but underpins surreal geostatistics. Each distance-weighted average is a functionally dependent value of a set of measured values. A set of n measured values gives df=n-1 degrees of freedom whereas the ordered set give dfo=2(n-1) degrees of freedom. Even an infinite set of Agterberg's zero-dimensional distance-weighted average point grades does not give a single degree of freedom!
A few things went wrong at Bre-X. Assuming spatial dependence between salted boreholes converted a massive amount of Busang's barren rock into Bre-X's gold resource. I used ANOVA to prove that the intrinsic variance of gold in Busang's 'ore' was statistically identical to zero.
Just select unbiased samples and test for spatial dependence between measured values. Think about taking a systematic walk when the sample space is two- or three-dimensional. That would be a good start to break bad habits. And do read my blogs. ■

Kriging & Geostatistics for Plume Delineation
I have noticed that a few people state that kriging is not the best method for 3D extrapolation of contaminant plumes and especially for mining.
If kriging is not the best method for this then what is? I first started with IDW because it was easy. RockWorks does this no problem. Then I moved to kriging using Tecplot. Problem is you can not apply your own variogram. Next I read that the author of GMS stated natural neighbor interpolation is better at subsurface extrapolation than kriging and IDW.
One thing is true IDW produced a massive bullseye effect with many of the small plumes I have worked with. I went back later and used kriging on those plumes and of course as suspected no bullseye.
I work with ultra high density data on the order of a sample measurment every 1 inch or less across 20~100' in the Z direction. Generally the xy directions are spaced 5m to 15m. I have no control of how the data is taken so I have to work with what I have.
Lately I have been trying to learn GSLIB which has it appears a steaper learning curve than the rest I have tried.
I have used the trial version of GMS and EVS Ctech.
Main thing for me is to produce these pretty pictures that no one really looks at in 3-D anyway. Personally though I want them to have functional value also.
So what is the best inter/extrapolation scheme that is easily exported to a 3-D viewer such as ArcScene, gOcad etc... ■