
1. Introduction

The control of dust emissions in material handling operations is becoming increasingly topical due to more stringent environmental and occupational health and safety regulations. Given their widespread use in bulk material transportation, belt conveyors are often the focus of attention when investigating fugitive dust emissions. An area of particular concern for dust control occurs during the transfer of bulk material from one conveyor to another. While the properties of the bulk material, such as particle size distribution and moisture content play a significant role in dust generation, the design of the transfer chute can also greatly influence the level of fugitive dust.
Currently, the majority of dust control systems for conveyor transfers are “active”, and require external energy and equipment, or suppressants. For example, many coal handling plants use process water to control dust emissions, therefore significantly increasing the potential for material handling issues throughout the rest of the plant. Often process constraints limit the amount of moisture that can be added to bulk materials, this combined with the importance of minimising water usage places a much greater emphasis on the need to develop “passive” dust control systems, where no external energy and equipment nor suppressants are required.
Passive control is achieved through the efficient integration of the moving stream of bulk material with the induced air flow. In view of this, it is becoming increasingly important that the objective of minimising fugitive dust emissions is incorporated into the design of transfer chutes, along with the traditional requirements to meet throughput without blockages, and to limit both lining material and belt cover wear.
Current technology in belt conveyor transfer chutes is such that passive dust control is mainly achieved by using an enclosure of sufficient volume so that the dust laden air within the enclosure eventually settles, and re-enters the exiting bulk material stream. Such systems are mainly used for slow speed installations, with a typical example illustrated in Fig. 2 (left).
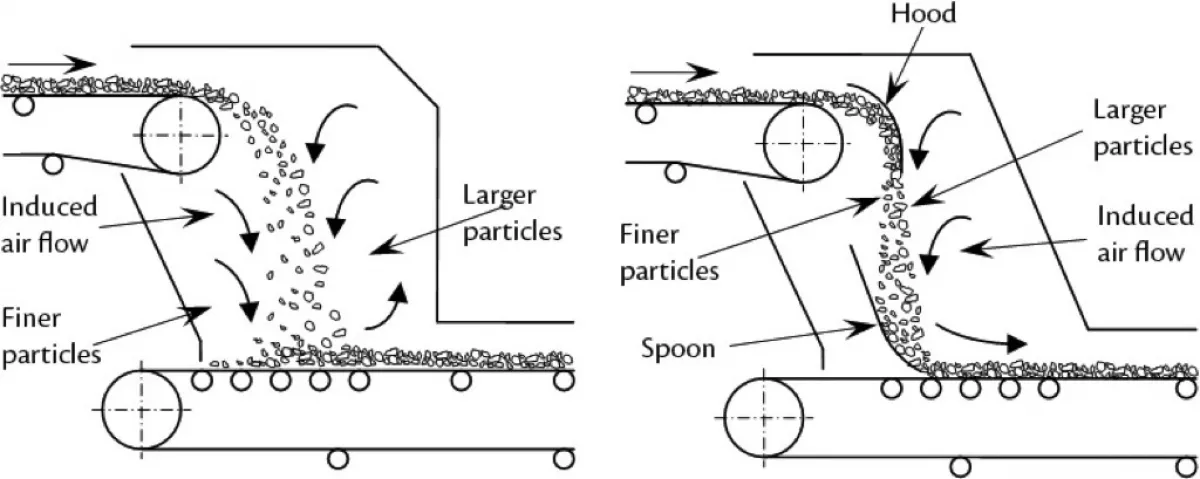
A better approach to passive dust control in conveyor transfers is to employ a “hood” and “spoon” chute system as illustrated in Fig. 2 (right) and, by appropriate analysis, integrate the dust control within the streamlined flow of bulk material. The aim is to ensure that the dust remains encapsulated in the material stream so it is unable to separate and disperse.
There are two well established methods for modelling the flow of bulk material through conveyor transfer chutes. These are the Discrete Element Method (DEM) and the Continuum Method. As the names suggest, the main difference between the two methods is that the former method models every individual particle in the flow, whereas the latter is defined by the space through which the particles travel and the particles are treated as a “fluid like” continuum.
When considering the analysis of dust in conveyor transfer chutes, there are a number of analysis procedures available [1]. These methods typically include one, or a combination of the following:
- Continuum Method – this method relies on a lumped mass approach of the bulk solid through the transfer chute and the prediction of dust is qualitative
- Computational Fluid Dynamics – this method can be further classified into sub-categories:
a) single phase flow where only the air is modelled with assumptions being made for the granular flow, and
b) multiphase flow, where both the air and the granular phase is modelled. - Discrete Element Method – discrete modelling of particles with assumptions being made regarding the flow of air.
- Computational Fluid Dynamics coupled with the Discrete Element Method – this category can be further classified into subcategories a) indirect coupling, which utilises DEM to estimate the granular flow and porosity of the material in different regions and then uses a porous single phase CFD simulation, and b) direct coupling, which involves coupling the DEM simulation directly with the CFD simulation.
When analysing the dust emission problem, CFD is more suitable than DEM since the air flow plays a critical role in dust circulation and emission. Both the Euler-Lagrange approach and the Euler-Euler approach are used in this area [2, 4], with the former limited to dilute flow. CFD also shows good potential for simulating granular flows by predicting flow shape, stream velocity, and location of flow recirculation zones due to the effect of the bulk material stream on air flow [3].
Ideally, the flow of bulk material and the interaction between the bulk material and dust particles with air would involve an integrated approach, employing DEM coupled with CFD. While research is progressively advancing in this area, to the authors’ knowledge, at this stage the technology has not sufficiently developed to accurately model the complex flows experienced in conveyor transfer stations. Alternatively, [5] provides a methodology for combining DEM and CFD to evaluate conveyor transfer chute performance using an empirical model for diffused dust emission.
The present work uses scale model testing to verify results obtained from numerical simulations. The commercial CFD software FLUENT was used to analyse air and particle flow in the transfer chute enclosure. The relative performance of each design in terms of minimising dust emission was predicted by analysing the air velocity and air mass flow rate. The validity and accuracy of CFD to predict dust emissions was verified by comparing the simulation results with scale model tests.
2. ExperimentalWork
2.1 Dust Measurement
The experimental work was conducted in the lab to evaluate the performance of the different chute designs regarding dust emission. In total six transfer chute configurations were analysed. These are labelled A through to F and include:
- A – baseline case,
- B – baseline case with a lower removable cover fitted,
- C – baseline case with a lower removable cover and lower openings fitted,
- D – a chute with an in-built restrictor plate in the vertical leg in addition to the lower removable cover fitted and lower openings closed,
- E – baseline with a stilling chamber and lower openings closed, and
- F – restrictor plate in addition to the stilling chamber and the lower openings closed.
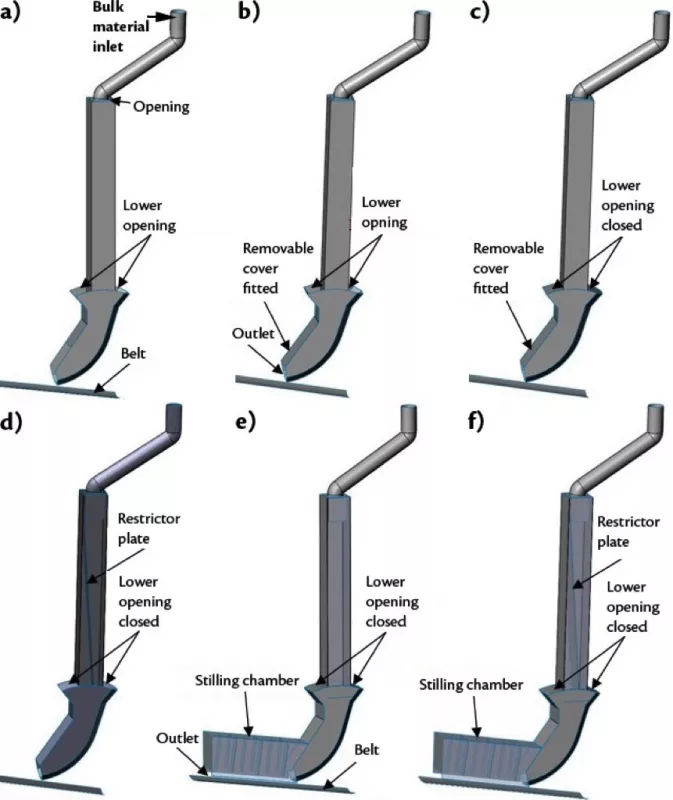
All six chute configurations are illustrated in Fig. 3.
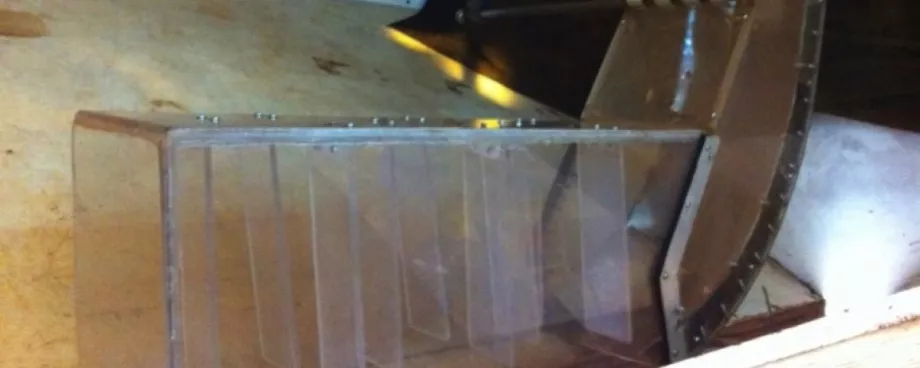
Fig. 1 shows the scale model chute with the stilling chamber installed – Chute E. The details regarding the experimental procedure are included in [6], while the results are summarised in Fig. 4.
From the results presented in Fig. 4 it can be concluded that the performance of Chute A, Chute B and Chute C are similar as the results are within the same range of values. Chute F can be seen to provide the most reduction in emitted dust, while Chute D and E both have a similar performance which was also a large improvement on the initial design. The inclusion of the restrictor plate has a large effect on the dust emission, which is evident in a comparison of the results between Chute C and Chute D.

2.2 Air Velocity Measurement
To provide a quantitative assessment of the CFD results Particle Image Velocimetry (PIV) measurements were undertaken. PIV facilitates flow visualisation and multi-point velocity measurement. The PIV system was used to measure the velocity profile of the dust laden air exiting Chutes A to D.
Experimental Setup
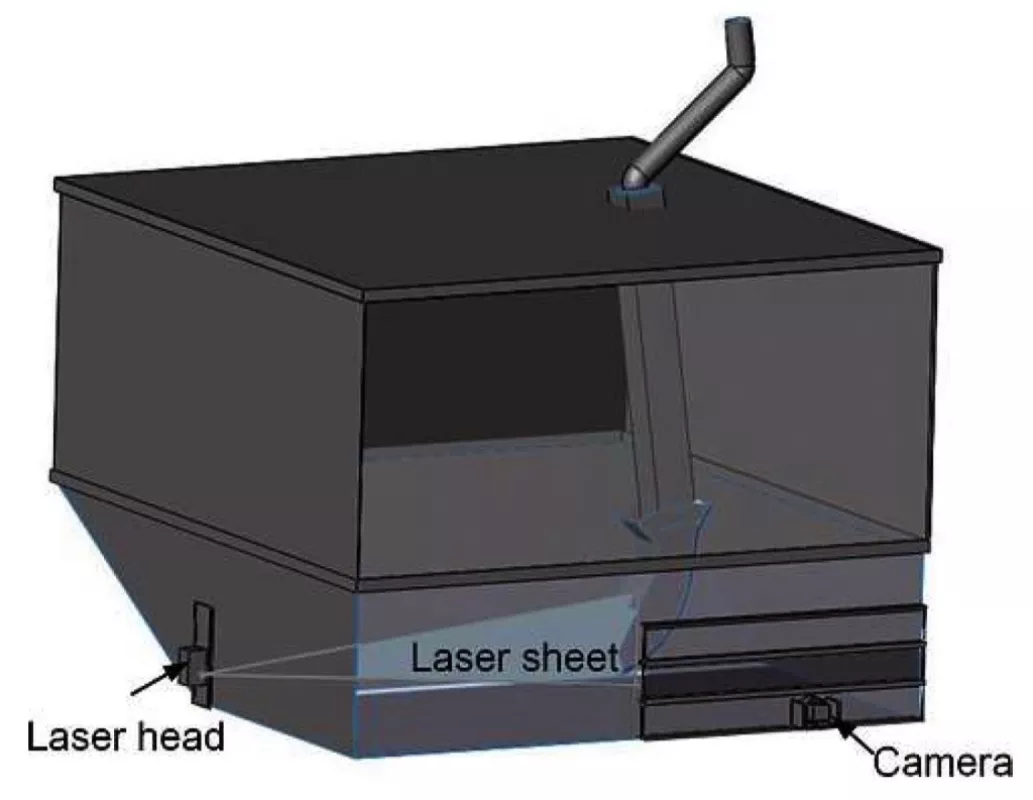
The PIV system used consisted of an Oxford Firefly diode laser and a high performance digital camera. The experiments were conducted in an enclosure measuring 2.5 metres wide, 2.5 metres long and 3.0 metres high, shown in Fig. 5. The scale model transfer chutes shown in Fig. 3 were housed within the enclosure, both for safety reasons due to the use of the laser, and also to contain the fugitive dust. Fig. 5 5 illustrates the experimental setup and shows the location of the laser and camera.
Due to the nature of the experimental work the application of the PIV technique is an indirect measurement method since the velocity of the entrained dust particles are measured instead of the air velocity. Therefore small tracer particles are critical in obtaining reasonable results as it is desired to measure the velocity of the air flow that entrains the dust particles. The experimental work used screened and washed iron ore as the primary bulk material with a size range of 4 to 11 millimetres, while minus 45 μm iron ore dust was added as the seeding particles.
3. CFD Simulations
CFD simulations were carried out for the six chute configurations using the commercial software FLUENT. For each of the six chute configurations, a multiphase CFD simulation was performed using two phases, a granular phase and an air phase.
3.1 Model Details
Due to the high volume fraction of particles, a two-phase EulerEuler approach was adopted to model the granular stream and air flow in the transfer chutes. A Eulerian treatment was used for both the fluid and solid phase. A single pressure is shared by the air and the particles, and the continuity and momentum equations solved separately for each phase. The models and boundary conditions used in the simulation are summarised in Table 1.
| Description | Model |
|---|---|
| Bulk viscosity | Lun-et-al |
| Granular viscosity | Gidaspow |
| Fractional viscosity | Shaeffer |
| Drag function | Gidaspow |
| Time | Unsteady |
| Air wall boundary | No slip |
| Inlet | Uniform velocity inlet |
| Opening | Pressure inlet |
| Outlet | Pressure outlet |
| Discretisation | 2nd order |
The air is assumed to be incompressible and at constant density, while the particles are assumed to be spherical and have a uniform density. A particle diameter of 4 millimetres was selected for the simulations. Due to the larger particles involved, a smaller particle-particle restitution coefficient of 0.6 was adopted and the effect of particle-wall collision was taken into account by setting the specularity coefficient as 0.2. The stress tensor of the solids phase is based on the continuum model of dense-gas kinetic theory by Gidaspow and Bezburuah [7] and considers the inter-particle friction force at high solids packing ratios. The fractional viscosity is included in the calculations using Shaeffer’s [8] friction model.
3.2 CFD Results
Representative images for two of the CFD simulations are shown in Fig. 6 (Chute A) and Fig. 7 (Chute F). In these figures the flow of the granular phase is shown by the streamlines and the flow of the air is represented by vectors. The simulation does not include a direct representation for the dust phase, so no direct comparison can be made for dust emissions between each configuration. However, both qualitative and quantitative comparisons are possible.
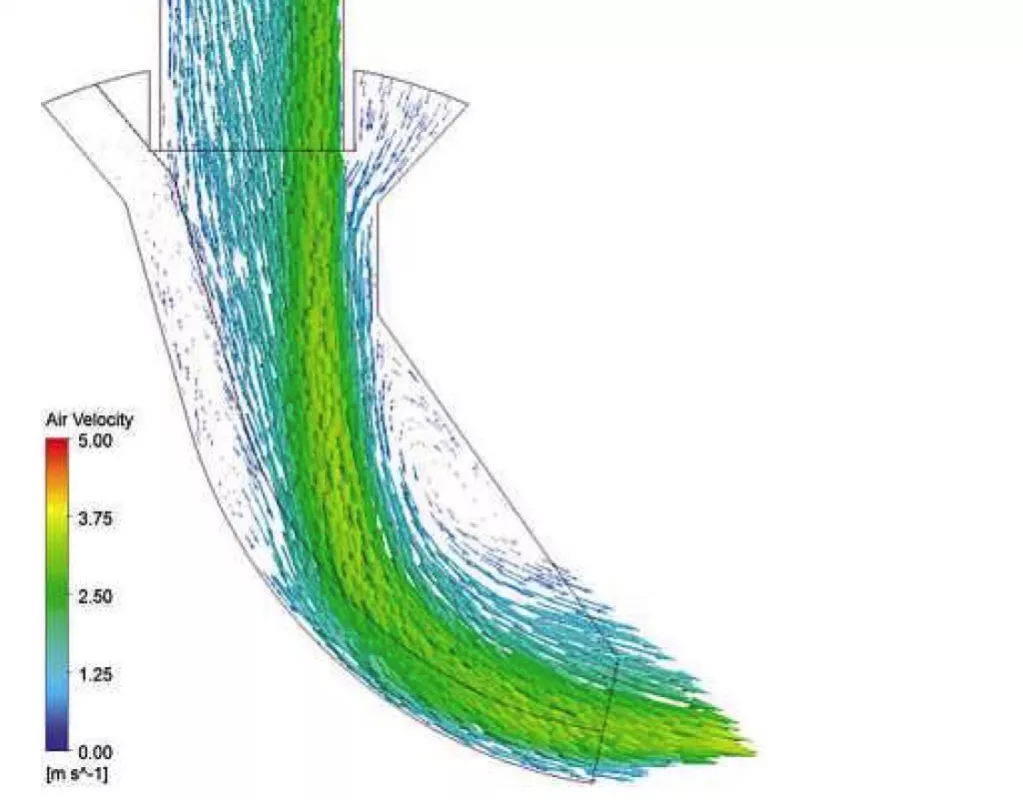
Fig. 6: Air vectors for Chute A.
|
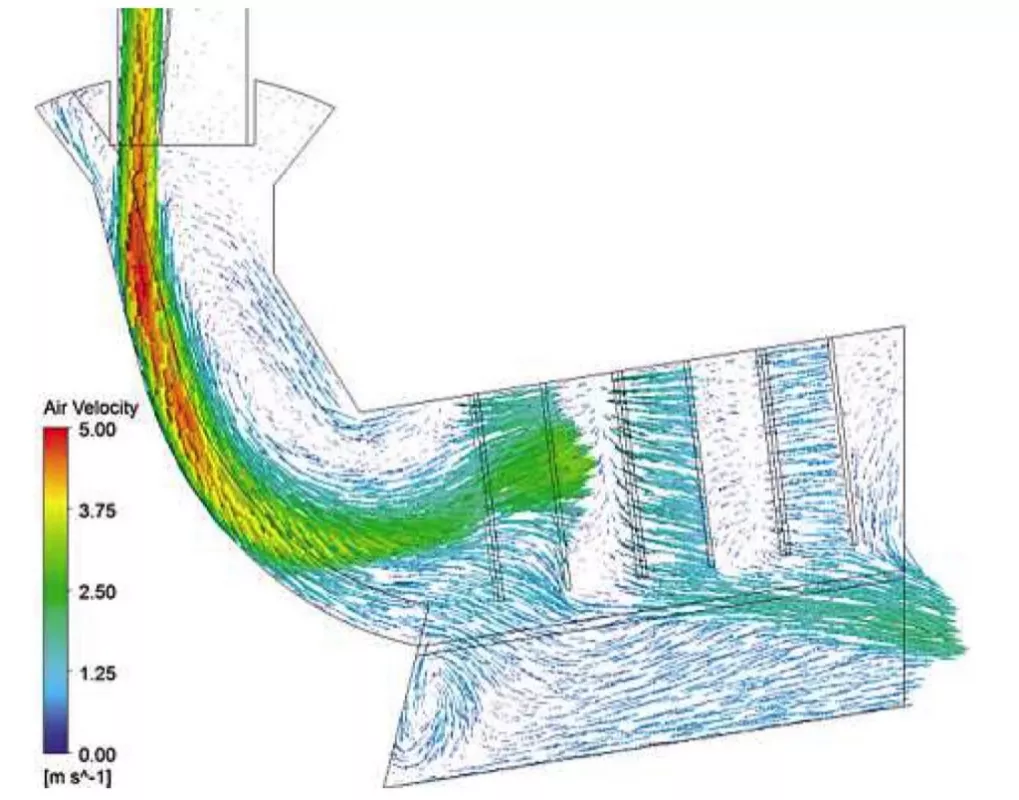
Fig. 7: Air vectors for Chute F.
|
From a comparison between Figs. 6 and 7, the effect of the restrictor plate is clear. In the case of the restrictor plate, the flow is faster and more streamlined resulting in less dispersion. In addition to this, the reduced impact angle between the stream and the chute in configuration F also contributes to the lower level of dispersion. Furthermore, the effect of the stilling chamber can be seen in Figs. 6 and 7, where the outlet air velocities are lower in the simulation with the stilling chamber. Lowering the air velocity has the additional effect of causing any larger dust particles to drop out of the air stream onto the receival conveyor belt.
4. Comparison of Results
As an initial step the measured air velocities were compared to the CFD results. In order to compare experimental results with simulation predictions, the PIV results presented represents averaged velocity measurements for 100 images. These results are compared to the CFD air velocity profiles along the centreline of chute outlet.
4.1 Calculated and Measured Air Velocities
Figs. 8 and 9 show the measured air vectors from the PIV experiments and the air vectors predicted from the CFD analysis for Chute A, while Figs. 10 and 11 show the same results for Chute D. Note the black lines shown in Fig. 8 and Fig. 10 represent the outline of the steel gusset in the scale model chute, and as such there is no data available from the PIV experiments in this region.
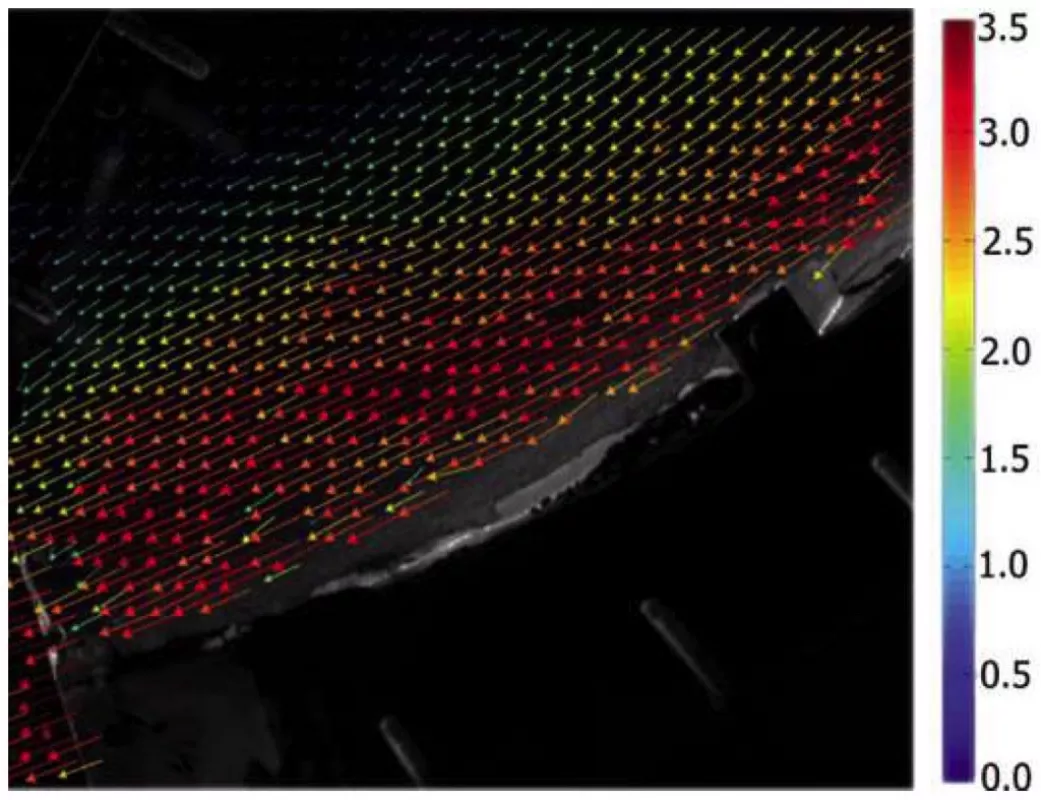
Fig. 8: Air vectors for Chute A from PIV experiments.
|
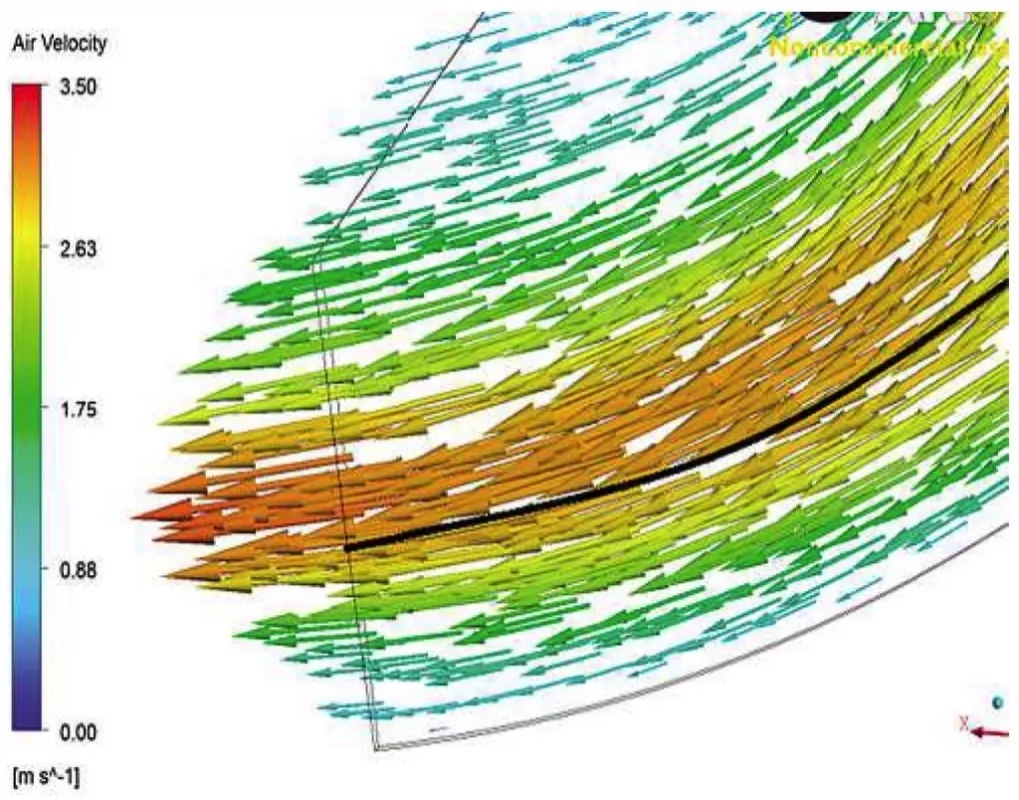
Fig. 9: Air vectors for Chute A from CFD analysis.
|
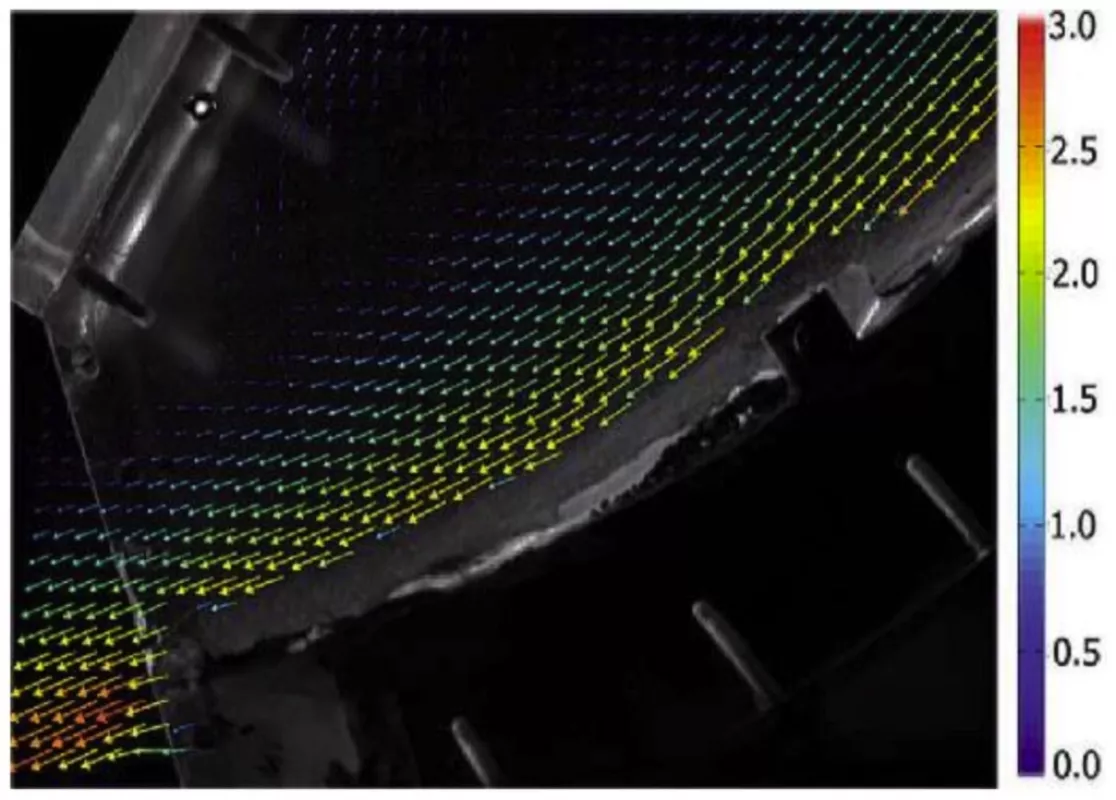
Fig. 10: Air vectors for Chute D from PIV experiments.
|
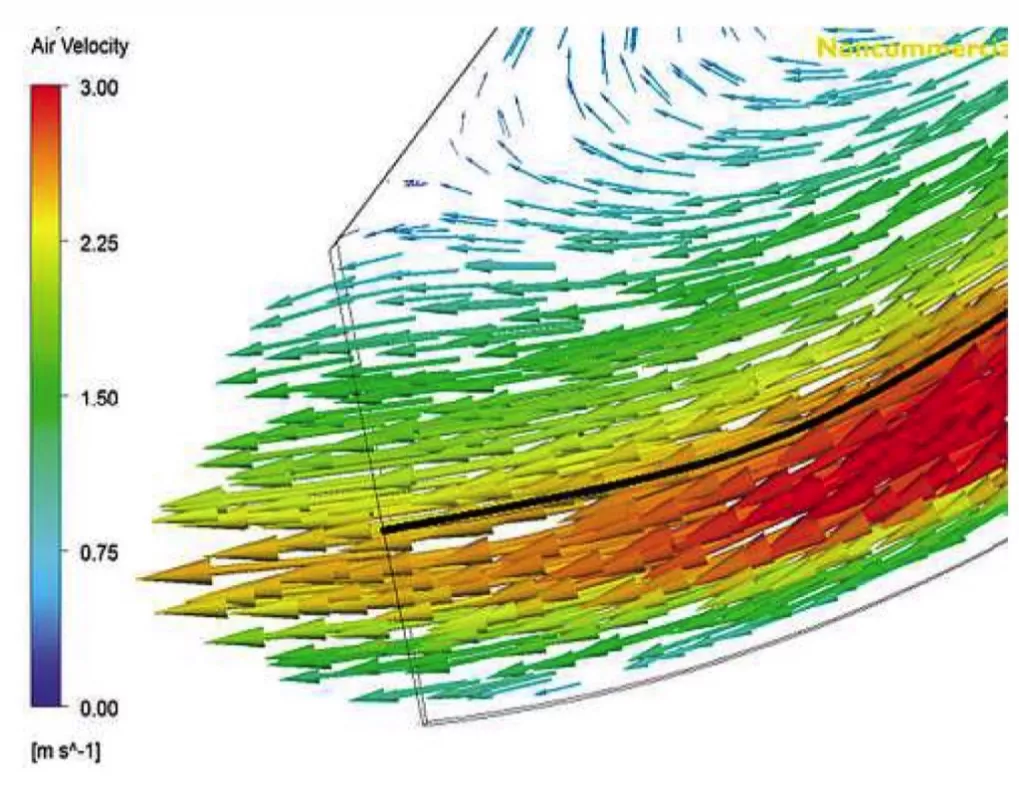
Fig. 11: Air vectors for Chute D from CFD analysis.
|
Qualitatively the predicted flow patterns for both cases agree well with the measured results. The experimental results are not as smooth as the simulation results but this is most likely due to the uneven distribution of seeding particles. Quantitatively the CFD analysis generally underestimates the air velocities when compared to the velocities measured by the PIV system. This is best illustrated in Fig. 12, where the theoretical and experimental values of the air velocity profile along the centreline of outlet for Chute A to D are compared directly.

The main reason for the variance between the measured and theoretical predictions can be attributed to the selection of appropriate values for the particle-particle coefficient, particle-wall coefficient and particle-air coefficient within the model. Furthermore, small changes between the experimental conditions and the model will result in different outlet conditions.
While there are variances between the measured and calculated air outlet velocities, the trends between the chute configurations are consistent. Furthermore, the CFD results correlate well with the experimental dust measurements, where low outlet velocities and therefore low air mass flow rates through the chute result in less overall dust emission.
4.2 Calculated Air Mass Flow Rate
Reducing air velocity will generally reduce dust entrainment, making the outlet air velocity from the chute a critical parameter to analyse. Furthermore, different air velocities lead to different air mass flow rates. More air flow through the chute typically indicates more dust will be entrained and therefore discharged from the chute. Comparison of the air mass flow rates for the various chute configurations and the location of the expelled air is presented in Fig. 13.
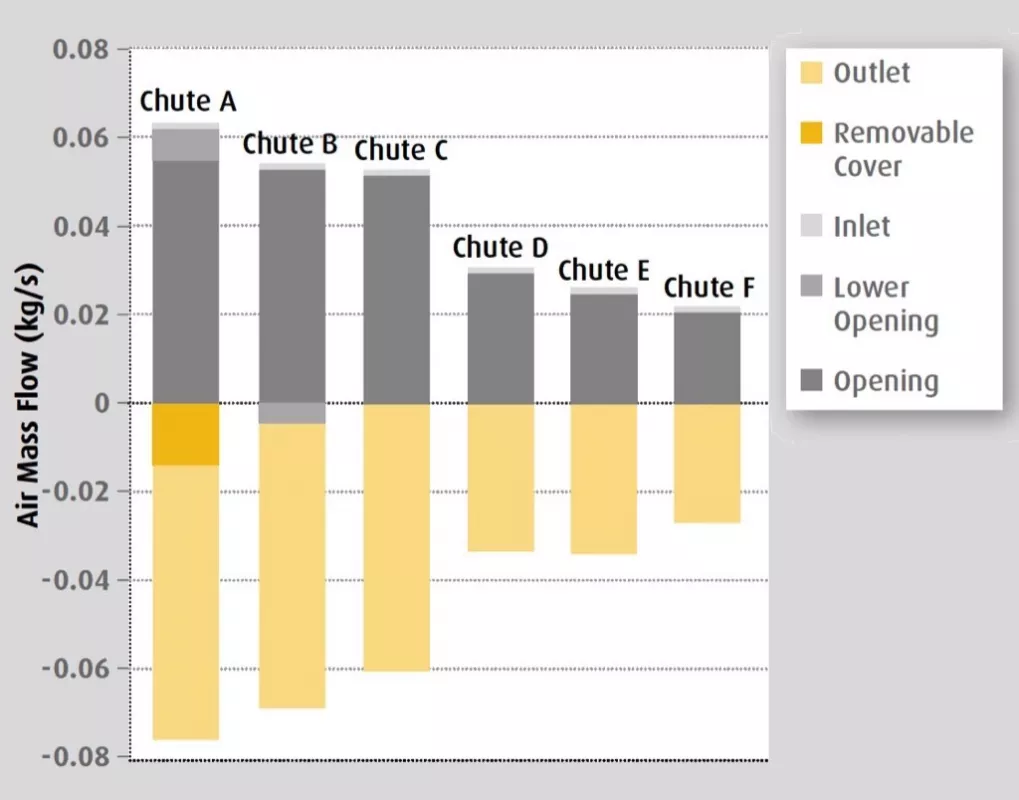
For all chutes, a positive air mass flow rate represents air entering the chute through the Inlet, Opening or Lower Openings, or a combination of these. Negative values indicate air exiting the chute, either from the Outlet, both the Outlet and the Lower Opening, or the Outlet and the Removable Cover.
Since all the chute configurations have exactly the same inlet conditions, the value of the air mass flow rate at the inlet is the same. However, there is a large difference in the total air mass flow rates between different chute configurations. The total air mass flow rate through Chute A is more than two times that of Chutes D and F. This occurs since more air is entering the enclosure at the Opening via the bulk material and entrained air for Chute A, than for Chutes D and F. Furthermore, comparing the mass flow rates of Chute E and Chute F, it indicates that Chute F performs better, which is consistent with the lower dust levels measured in the experimental work.
Overall the relative performance of each chute configuration compares well with the experimental results illustrated in Fig. 4. There is no direct evidence to suggest significant performance differences between Chutes A, B and C, with air velocities and air mass flow rates being comparable, which is in agreement with the experimental results. Furthermore, it is clear that Chutes D, E and F have lower air mass flow rates, therefore supporting the lower dust levels measured in the experimental work.
5. Conclusions
A study was undertaken with the overall aim of analysing dust emissions from belt conveyor transfer chutes. Several transfer chute configurations were investigated with the aim of analysing system performance using scale model testing and CFD simulations. The experimental work involved measuring the quantity of fugitive dust, in addition to the velocity of the entrained air at the exit of the chutes using Particle Image Velocimetry (PIV). The CFD analysis was used to investigate the flow pattern of the granular material and entrained air in each transfer chute configuration using a two-phase three-dimensional Euler-Euler model. The predicted dust emissions obtained from the simulations compared favourably with the scale model test results, demonstrating that CFD can be effectively used to evaluate the performance of transfer chute design in relation to likely dust emissions.
■
